Figures & data
Figure 1. Breast cancer cells up-regulate PD-L1 in response to infection by CF33-hNIS-ΔF14.5. (a) Cells were mock-infected or infected with CF33-hNIS-ΔF14.5 at MOI 3. Eighteen hours post-infection, cells were stained with APC-conjugated PD-L1 antibody or an isotype antibody and analyzed by flowcytometry. (b) Cells were infected and PD-L1 levels determined as in (a) and mean of three independent experiments ± SEM has been plotted. p values were calculated using Student’s t-test. (c) C57BL/6 mice (n = 4/group) bearing orthotopic E0771 tumors were intra-tumorally injected with PBS or 107 PFU of virus on days 1, 3 and 5. On day 7, tumors were harvested and stained for PD-L1 as described in materials and methods. (d) Area in the tumor sections that stained positive for PD-L1 was calculated using QuPath software and compared between the two groups (n = 4/group). Data presented as mean ± SEM. p value was calculated using Student’s t-test
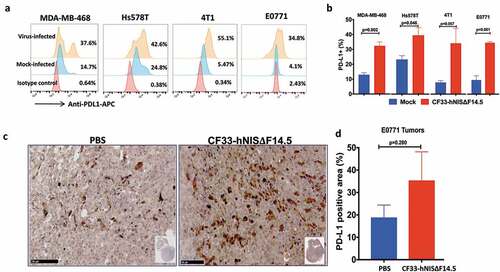
Figure 2. Growth kinetics and Cytotoxicity. (a) human BrCa (MDA-MB-468 and Hs578T) and mouse BrCa (4T1 and E0771) cells were infected with CF33-hNIS-ΔF14.5 at an MOI of 0.03 and virus titers in cell lysates were determined by plaque assay at indicated time points. (b) Cells were infected at indicated MOIs of CF33-hNIS-ΔF14.5 and cell survival relative to mock-infected cells were determined 72 h post-infection. Data presented as mean of three independent experiments with SEM
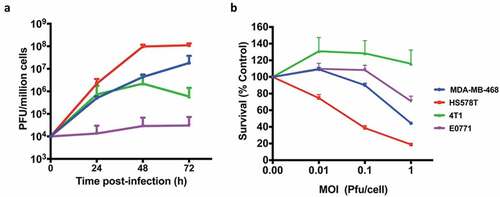
Figure 3. Combination of CF33-hNIS-ΔF14.5 (i.t.) with αPD-L1 (i.p.) delays tumor growth and increases survival of mice. (a) Treament scheme showing timing and routes of treatment. Bilateral tumors were generated in abdominal mammary fat pads of C57BL/6 mice by injecting 105 E0771 cells on one side and 2 × 10⁴ E0771 cells on the other side. Only one tumor/mouse (larger tumor) was injected with 107 PFU of virus and the other (smaller) tumor was left un-injected. αPD-L1 Ab (100 µg) was injected intra-peritoneally. Treatments (n = 7 mice/group) were given on each of experimental days 1, 3 and 5. (b) Average tumor volume for virus-injected and un-injected tumors at different time points with SEM has been plotted and compared. p values were calculated using Two-way ANOVA with Dunnett's test. (c) Mice were euthanized when tumor volume exceeded 2500 mm3 and survival of mice among the treatment groups was compared using log-rank Mantel–Cox test
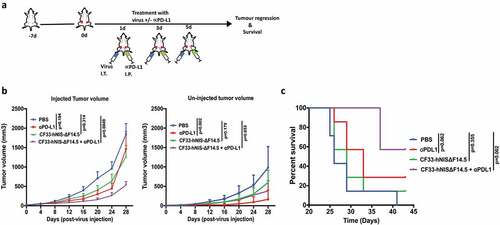
Figure 4. Combination of CF33-hNIS-ΔF14.5 with intra-tumoral injection of αPD-L1 results in synergistic anti-tumor effect. (a) Experimental scheme. Mice bearing single orthotopic E0771 tumors (n=7 mice for PBS group and 8 for all other groups) were treated with PBS or CF33-hNIS-ΔF14.5 (107 PFU) or α-PD-L1 Ab (100 µg) or combination of CF33-hNIS-ΔF14.5 and α-PD-L1 on each of experimental days 1, 3 and 5. All treatments were given intra-tumorally. (b) Tumor volumes in different treatment groups have been plotted. Each line represents tumor volume of an individual mouse. Numbers in parentheses indicate the number of mice that achieved complete tumor regression. (c) Per cent body weight for each treatment groups has been plotted with SEM. (d) Average tumor volume at different time points with SEM has been plotted and compared. Stats: Two-way ANOVA with Dunnett's test. (e) Mice were euthanized when tumor volume exceeded 2500 mm3 and survival of mice among the treatment groups was compared. Stats: log-rank Mantel–Cox test
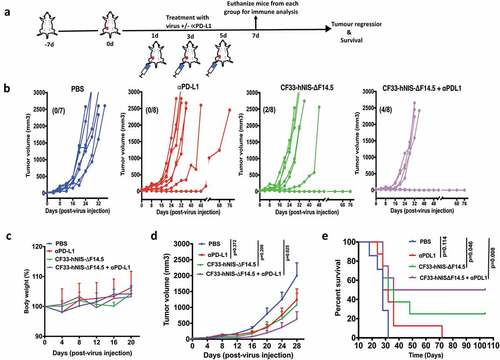
Figure 5. Favorable modulation of tumor immune microenvironment by CF33-hNIS-ΔF14.5. E0771 tumor-bearing mice were treated as in and tumors were harvested 7 days after the first dose of treatment and single cells were prepared (n = 4 mice/group). Cells were stained for surface markers (CD45, CD8, CD4 and PD-L1) and intracellular protein (IFNy) following live/dead staining. (a) A flow diagram showing gating strategy. (b) Comparison of different immune cell population and PD-L1 levels (on nonimmune cells, CD45-) among different treatment groups. p values were calculated using one-way ANOVA
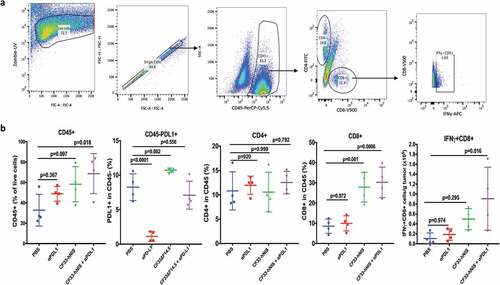
Figure 6. Favorable modulation of tumor immune microenvironment by CF33-hNIS-ΔF14.5. E0771 tumors that were treated as in were harvested 7 days after the first dose of treatment and fixed in formalin. Tumor sections were stained with H&E to visualize tumor morphology (pictures shown at 5X magnification; scale bar = 500 μm). Immunohistochemical analyses were performed to visualize CD4+ or CD8 + T cells (pictures shown at 20X magnification; Scale bar = 100 μm). Whole tumor sections were scanned, and targets were quantified using QuPath software. Necrotic areas were excluded for the quantification of CD4 and CD8 T cells. Stats: One-Way ANOVA
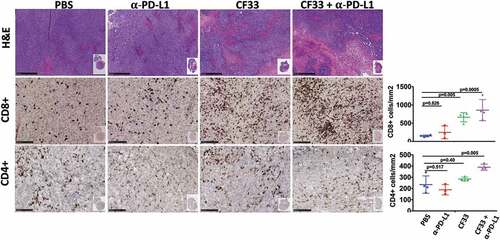
Figure 7. CF33-hNIS-ΔF14.5 in combination with αPD-L1 increases pro-inflammatory cytokines in TME but not in serum. E0771 tumors were treated as in and tumors as well as serum were harvested 7 days after treatment. Tumors were homogenized to obtain tumor lysates. A multiplex bead-based assay was used to quantify 13 cytokines in the tumor lysates. (a) Heat-map showing all the 13 cytokines in the tumor lysates in the 4 treatment groups (n = 4 mice/group). (b) Heat-map showing all the 13 cytokines in the serum of the mice. Samples were analyzed in duplicates. (c) Mean concentration of IFNy, IL-6 and TNF-a in tumor lysates and serum have been plotted with SEM. One-Way ANOVA was used to calculate p values. Note: color scales for Tumor (Figure (a)) and Serum (Figure (b)) are different
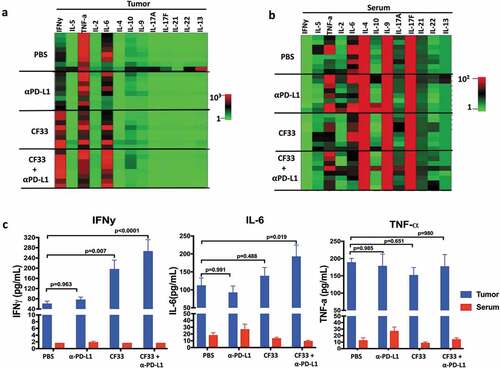
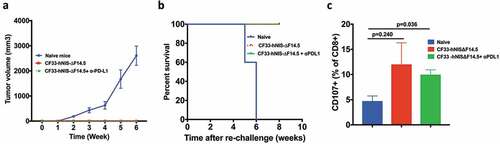
Figure 8. Mice treated with CF33-hNIS-ΔF14.5 alone or in combination develop tumor-specific immunity. Mice that underwent complete tumor regression from , and remained tumor free for 30 days, were re-challenged with 105 E0771 cells in the abdominal mammary fat pad of opposite side. Age-matched naïve mice were used as control. (a) Tumor volumes were measured weekly and average tumor volumes have been plotted with SEM. Tumors were detected only in the naïve mice. (b) Mice were euthanized when their tumor exceeded 2500 mm3 in volume, and survival was compared using Kaplan–Meier survival plot. (c) CD3+ T cells were isolated from the mice at the end point and re-stimulated with E0771 cells. Cells were stained with antibodies against CD8 and CD107 and analyzed using flowcytometry. Per cent CD8+ T cells positive for CD107 marker have been plotted with SEM and compared among the groups. Stats: One-Way ANOVA