
Figures & data
Figure 1. FH changes the morphology and prolongs the viability of monocytes
(a) Morphological changes in human peripheral blood CD14+ monocytes upon incubation for 48 h with RPMI 1640 medium, 150 μg/ml FH, α1-AT or heat-denatured FH. (b) Cell death assessed by Sytox green inclusion of monocytes incubated with medium, 150 μg/ml FH or α1-AT for 8 days. (c) Morphology of mouse bone marrow progenitor cells incubated with medium or 150 μg/ml FH for 6 days. (d–i) Scanning electron microscopy of monocytes incubated with medium (d–f) or 150 μg/ml FH (G-I) for 6 days. (j–n) Quantification of cell circularity (j), elongation (k), cell area (l), cellular vesicles (m) and cell-cell contact (n) of CD14+ monocytes cultured for 2 and 6 days in medium, 150 μg/ml FH or α1-AT. Data are means ± SD of n=500 cells.
Figure 2. FH differentiates monocytes into macrophages
Primary human CD14+ monocytes were cultured for 7 days (a–h) or 48 h (i–l) with 150 μg/ml FH, 150 μg/ml α1-AT, 25 ng/ml GM-CSF or 25 ng/ml M-CSF. (a) Morphology of seven-day cultured macrophages. (b–f) Flow cytometric determination of size and granularity (b) as well as surface expression of macrophage-specific markers CD163 (c), CD11c (d), CD206 (e), and CD68 (f). Representative histograms of n=4 independent experiments are displayed. (g–l) Phagocytosis was determined as fluorescent intensity of pHrodo-labeled apoptotic cells (g, j), nucleosomes (h, k) and zymosan (l) in relation to calcein violet intensity (live cells). (i) For visualization, a representative fluorescent image of monocyte phagocytosis of pHrodo-zymosan is displayed. Data are means ± SD of n=6 individual donors.
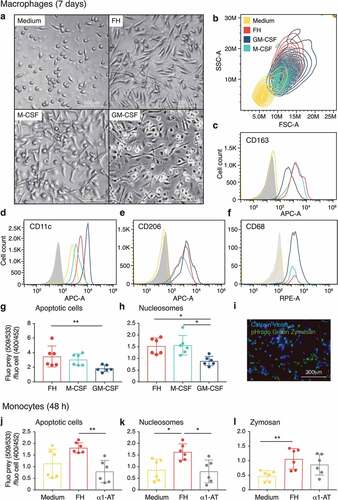
Figure 3. The morphological changes upon FH stimulation in CD14+ monocytes are induced by CCP19-20 and are inhibited by plasma
(a, b) Localization of FH was analyzed using confocal microscopy. Primary human CD14+ monocytes were permeabilized after 5 min (a) or 30 min (b) incubation with 150 μg/ml FH. The membrane was visualized with anti-CD44 Ab (green) and FH was detected with antiserum (red). The nuclei were counterstained with DAPI (blue). The confocal XY image with orthogonal YZ view. (c) FH at early stages of internalization is co-localized with endosomes. Primary human CD14+ monocytes were permeabilized after 15 min incubation with 150 μg/ml FH. The endosomes were detected with EEA1 Ab (green) and FH was detected with antiserum (red). Nuclei were counterstained with DAPI. (d) Internalization of FH was confirmed by fractionation of monocyte lysates incubated prior for 30 min with or without 150 μg/ml biotinylated FH. Endosomes were detected in the same fraction with EEA1 antibody (e–g). Morphology of 48h cultured monocytes. CD14+ and CD16+ monocytes were purified with specific microbeads and incubated with 150 μg/ml FH (e). CD14+ monocytes were additionally incubated with the same molar concentration of FH CCP1-7 and CCP19-20 (f). Plasma effects were studied on monocytes stimulated with 150 μg/ml full-length FH and supplemented with 1% and 20% autologous plasma (g). Mo – monocytes, Mo+FH – monocytes incubated with FH.
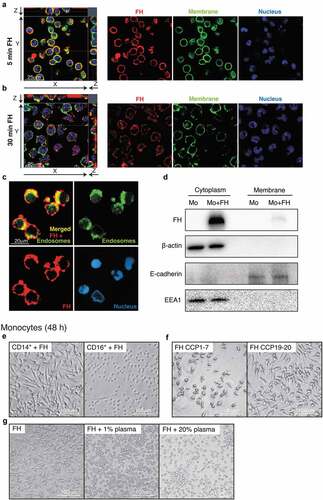
Figure 4. Transcriptome analysis of FH-stimulated monocytes
Affymetrix GeneChip expression profiling assay on primary human CD14+ monocytes of six individual donors incubated for 48 h with RPMI medium or 150 μg/ml FH. (a) Volcano plot of microarray data highlighting 70 genes with a nominal p-value <0.0001. Genes of interest that display both large magnitude fold-changes (x-axis) and high statistical significance (-log10 of p-value, y-axis) are marked in red. (b) mRNA expression levels of four most regulated genes in six independent donors normalized to housekeeping gene. (c–d) Heat maps representing the most regulated genes involved in M2 polarization and cancer-associated macrophage function. (e) Highly regulated pathways involved in monocyte and macrophage function, differentiation, polarization and involvement in cancer pathology (e). Data of n=6 individual donors.
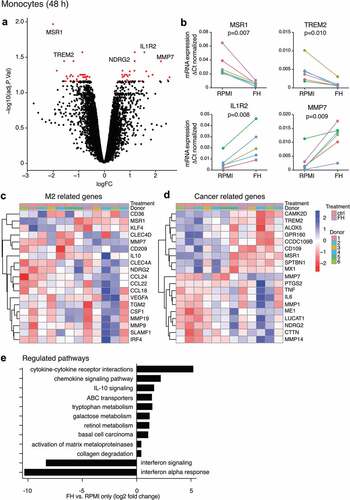
Figure 5. FH induces an anti-inflammatory cytokine release profile
(a–d) CD14+ monocytes were cultured for 48 h with medium, 150 μg/ml FH or 150 μg/ml α1-AT and further stimulated with 100 ng/ml LPS for the last 15 h (b and c). (e) Macrophages were differentiated for 7 days with 150 μg/ml FH, 25 ng/ml M-CSF or 25 ng/ml GM-CSF. M1 and M2 macrophages were generated by additional incubation for 4 h with 100 ng/ml LPS or 20 ng/ml IL-4 and IL-13. (a–e) FH-rendered changes in cytokine release with (b, c) and without (a, d, e) LPS co-stimulation. Levels were determined with Bio-Plex Pro human cytokine 27-plex assay (a, b, e) or ELISA (c, d). Data are means ± SD of n=4 (a, b), n=5 (d, e), and n=3 (c) individual donors. Significances (b–e) are calculated in comparison to FH.
Figure 6. FH-induced macrophages exhibit a suppressive phenotype
(a–f) Macrophages were differentiated for 7 days with 150 μg/ml FH, 25 ng/ml MCSF or 25 ng/ml GM-CSF. (e, f) M1 and M2 macrophages were generated by additional incubation for 4 h with 100 ng/ml LPS or 20 ng/ml IL-4 and IL-13. (a) Proliferation and (b) clusters size of autologous CFSE-labeled CD4+ T-cells incubated for 3 days with macrophages stimulated with 10 or 100 ng of superantigens. (c–d) Flow cytometric determination of PD-L1 (c) and HLA-DR (d) surface expression. Representative histograms of n=4 independent experiments are displayed. (e) Kinetic and (f) endpoint measurement (45 min) of arginase activity were assessed by arginase activity assay kit. Data are means ± SD of n=5 (a, b) n=4 individual donors (e, f). Significances (a, b, f) were calculated in comparison to FH.
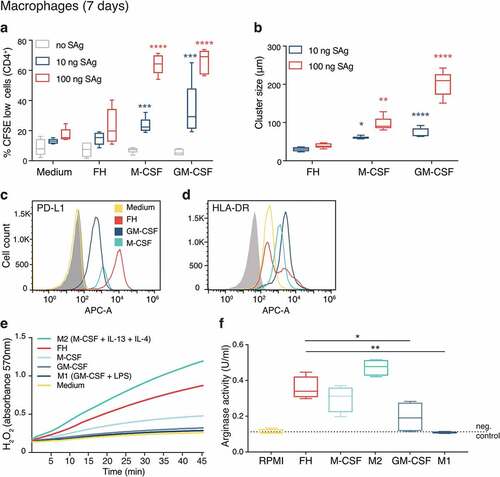
Figure 7. FH produced in breast tumors correlates with recurrence, disease severity and occurrence of M2 macrophages
(a) Specificity of FH staining was determined in HEK 293 cells, transfected with FH or mock transfected. (b, c, d) Staining of FH in tissue microarrays (TMAs) from breast cancer patient cohort with antibodies recognizing different regions of the protein. (e, f, g, h) Scoring of FH levels in TMAs from breast cancer patient cohort. Representative pictures for each score at 40x magnification are presented. (i, j) Cancer-specific survival and recurrence-free survival associate with FH expression. Scores 1–3 were grouped as FH positive, score 0 was denoted as FH negative. (k) Analysis of correlation between FH expression and infiltration of CD163+ macrophages in 1006 patient samples from the OncoLnc. (l) Confirmation of correlation between survival and FH expression using the TCGA database and SurvExpress search engine, based on the low or high risk for a poor outcome.
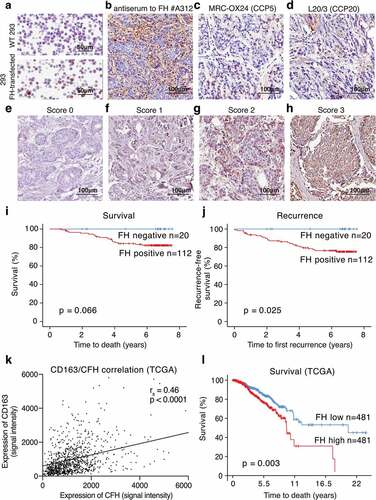
Table 1. Association between FH and clinical parameters
Supplemental material