Figures & data
Table 1. Retrospective data on the association between serum LDH levels and outcomes following checkpoint inhibition in other cancer types than melanoma
Figure 1. Glucose metabolism in cancer
(a). In cancer cells, glycolytic activity is increased. This metabolic shift is thought to be beneficial for tumor cells as the increased glycolytic flux lead to the synthesis of cellular building blocks and NADPH, which is essential for control of redox potential. HIF-1 is an important regulator of glycolytic activity. The enzyme LDH is a major player in glucose metabolism. In glycolytic conditions, LDH converts pyruvate into lactate. Lactate is transported out of the cell by MCT transporters and decreases the pH in the tumor microenvironment. (b). LDH is tetrameric molecule consisting of LDH-H (dark blue) and LDH-M (light blue) subunits. LDH isoforms consisting predominantly of LDH-M subunits preferentially catalyze the conversion of pyruvate to lactate. GLUT = glucose transporter; PDH = pyruvate dehydrogenase; PDK = pyruvate dehydrogenase kinase; MCT = monocarboxylate transporter.
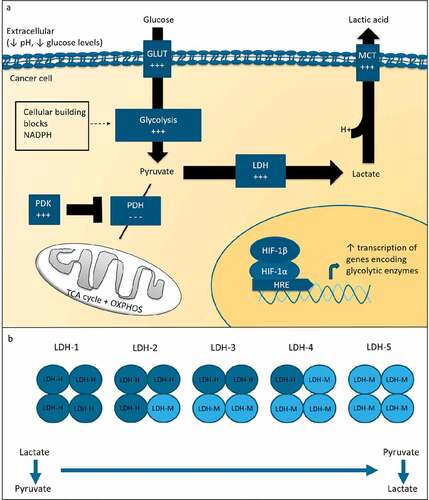
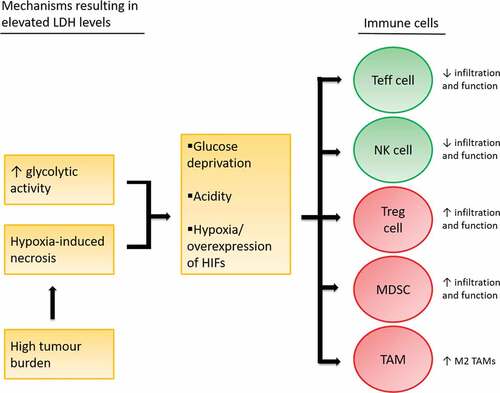
Figure 2. Immune suppressive effects of glucose deprivation, tumor acidity and hypoxia
Elevated LDH levels are the product of enhanced glycolytic activity and hypoxia-induced necrosis, the latter of which is associated with high tumor burden. Glucose deprivation, acidity and hypoxia affect immune cell function.