
Figures & data
Figure 1. VPA delays the progression of EL4 and B16-F10 tumors
(a) EL4 and (b) B16-F10 tumor volumes were calculated periodically. Five days after inoculation with EL4 cells, mice received daily intraperitoneal injection of PBS or VPA (500 mg/kg). Data are means ± S.E.M. of pooled from three independent experiment. (****p < .0001 by two-way ANOVA). Eight days after inoculation with B16-F10 cells, mice received daily intraperitoneal injection of PBS or VPA (500 mg/kg). Data shown as mean ± SEM pooled from three independent experiments. (***p < .001 by two-way ANOVA)
Figure 6. VPA enhances response to anti-PD-1 immunotherapy
(a, b) EL4 tumor-bearing mice were treated daily with PBS or VPA (500 mg/kg) from day 5 to day 14 in combination with an anti-PD-1 Ab or IgG (400 µg/mouse) on days 5, 8, and 11. (c, d) B16-F10 tumor-bearing mice were treated daily with PBS or VPA (500 mg/kg) from day 8 to day 16, in combination with an anti-PD-1 Ab or IgG (400 µg/mouse) on days 8, 11, and 14. (a, c) Tumor volumes were calculated periodically and are shown as means ± S.E.M., pooled from two independent experiments with n = 6–8 (**p < .01, ***p < .001, and ****p < .0001 by two-way ANOVA) (b, d) Survival of EL4 and B16-F10 tumor-bearing mice (n = 6 per group) was examined. (*p < .05, **p < .01, ***p < .001 compared with PBS + IgG group by Log-rank test). (e) VPA down-regulated CCR2 expression on M-MDSCs via HDAC modification and reduced M-MDSCs migration into tumor site, resulting in CD8 and NK activation, leading to reduction of tumor as illustrated. Our findings show that VPA in combination with an immunotherapeutic agent could be a potential new anti-cancer therapy.
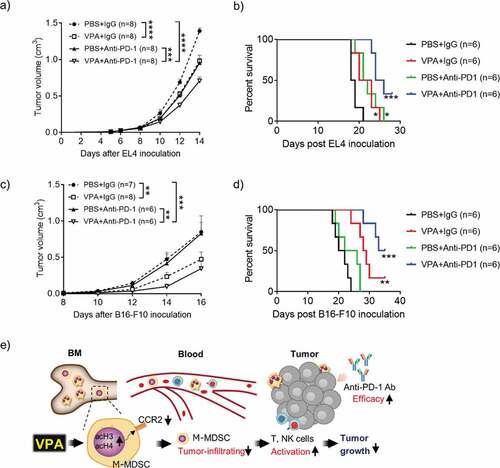
Figure 2. VPA reactivates tumor-infiltrating immune cells
Flow cytometric analyses of EL4 tumors from PBS- or VPA-treated tumor-bearing mice 14 days after EL4 inoculation. The proportion of (a) MDSCs (CD11b+Gr-1+), (b) TAMs (CD11b+Ly-6C−Ly-6G−F4/80+), (c) Tregs (CD4+CD8α−CD25+), (d) CD8+ T-cells (CD3ɛ+NK1.1−CD8α+), and (e) NK cells (CD3ɛ−NK1.1+) in total live cells are represented as means ± S.E.M, pooled from two (CD8+ T-cells, and NK cells) (n = 8–9), three (TAMs and Tregs) (n = 10–12), or four independent experiments (MDSCs) (n = 17). (*p < .05 by Student’s t test). (f) The proportion of CD69hi cells in CD8+ T -cells (CD3ɛ+CD8α+CD4−) and NK cells (CD3ɛ−NK1.1+) was analyzed. Data represent one experiment representative of three independent experiment. FMO, fluorescence minus one
Figure 3. VPA impairs EL4 tumor progression via anti-tumor immune cells
(a) Five days after inoculation with EL4 cells, mice received daily intraperitoneal injection of PBS or VPA (500 mg/kg). Anti-CD8α and anti-NK1.1 (200 µg/mouse) Abs were injected intraperitoneally on days 4, 7, and 10. Data are means ± S.E.M., pooled from two independent experiments with n = 8 per group (***p < .001, ****p < .0001 by two-way ANOVA). (b) Purified CD8+ T-cells (CD3ɛ+CD8α+) were plated at a density of 105 cells/wells in the presence of different concentrations of VPA (0, 0.1, 1 mM) and then stimulated with anti-CD3ɛ/anti-CD28 Abs. (c) Purified NK cells (CD3ɛ−NK1.1+) were plated at a density of 5 × 10⁴ cells/wells in the presence of different concentrations of VPA (0, 0.1, 1 mM), and then stimulated with IL-2. Both T-cell and NK cell proliferation was assessed using the eFluor 670 dilution assay and IFN-γ expression was analyzed by flow cytometry after 4 days of incubation. Data correspond to one representative experiment (n = 3).
Figure 4. VPA reduces the infiltration of M-MDSCs in EL4 tumors
Flow cytometric analyses of BM, spleen, blood, and tumors from PBS- or VPA-treated EL4 tumor-bearing mice 14 days after EL4 inoculation. The proportion of each population is plotted; (a) M-MDSCs (CD11b+Ly-6G−Ly-6Chi) and (b) PMN-MDSCs (CD11b+Ly-6G+Ly-6Cint). Data represent the means of two (blood) or three (BM, spleen, and tumor) independent experiments (*p < .05, **p < .01, and ****p < .0001 by Student’s t test). (c) CCR2 expression levels in PMN-MDSCs and M-MDSCs from PBS-treated tumor-bearing mice assessed by flow cytometry. (d) The proportion of CCR2+ MDSCs among total M-MDSCs in BM, spleen, and tumor from PBS- or VPA-treated mice. Data represent means ± S.E.M. of three independent experiments (*p < .05, **p < .01 by Student’s t test). (e, f) CCR2 expression on in vitro MDSCs following treatment with different concentrations of VPA or VPM. Data are one experiment representative of two independent experiments. (g) BM cells were harvested from EL4 tumor-bearing mice treated with PBS or VPA. The migration index was calculated as a ratio of the number of migrated cells treated with chemokines CCL2/CCL7 to that in non-treated wells. Data represent means ± S.D. in triplicate of one representative experiment from two independent experiments. (**p < .01 by Student’s t test)
Figure 5. VPA attenuates the immunosuppressive activity of MDSCs in vivo.
(a) Spleens were harvested from PBS- or VPA-treated EL4 tumor-bearing mice on day 14. M-MDSCs (CD11b+Ly-6Chi) and PMN-MDSCs (CD11b+Ly-6Cint) were isolated by FACS sorting (> 90% purity). (b) Isolated PMN-MDSCs or M-MDSCs were combined in a 1:1 ratio with eFluor 670-labeled CD4+ T-cells, followed by stimulation with anti-CD3ɛ and anti-CD28 Abs. After three days of incubation, the proliferation of CD4+ T-cells was analyzed using flow cytometry. N.C., negative control (without anti-CD3/CD28 stimulation). The data shows one experiment representative of two independent experiments. (c and d) EL4 tumor-bearing mice were treated daily with PBS or VPA (500 mg/kg) from day 5 to day 14, in combination with treatment with an anti-Ly-6G Ab or IgG (400 µg/mouse) on days 4, 7, and 10. B16-F10 tumor-bearing mice were treated daily with PBS or VPA (500 mg/kg) from day 8 to day 16, in combination with an anti-Ly-6G Ab or IgG (400 µg/mouse) on days 7, 10, and 13. (c) EL4 and (d) B16-F10 tumor volumes were calculated periodically as shown. The tumor volumes are shown as means ± S.E.M., pooled from two independent experiments (n = 7–10) (***p < .001, ****p < .0001 by two-way ANOVA).
Supplemental material