Figures & data
Table 1. Number of sarcomas analyzed by assay method
Table 2. Characteristics of UPS, MFS and OSA patient cohorts presenting with non-metastatic disease
Figure 1. IHC of PD-L1; (a) UPS case with high PD-L1, (b) UPS case with low PD-L1, (c) MFS case with high PD-L1, (d) MFS case with low PD-L1, (e) OSA case with high PD-L1 and (f) OSA case with low PD-L1. All immunohistochemical-stained images were taken at the equivalent of x20 magnification
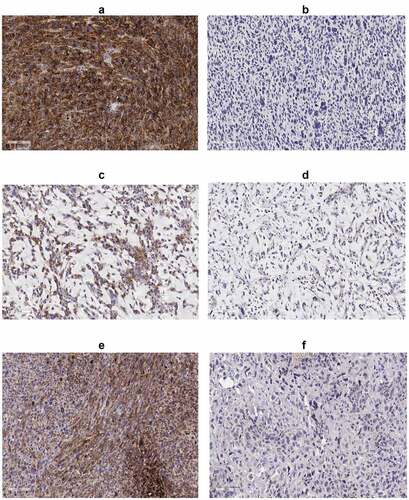
Figure 2. Distribution of IHC scoring in soft-tissue sarcomas by dot plots: (a) PD-L1 tumor, PD-L1 immune, PD-1 immune in 25 UPS, 25 MFS, 25 LPS, 24 LMS; (b) CD3, CD8, CD4, CD20 in 25 UPS, 25 MFS, 25 LPS, 24 LMS; (c) CD68, CD163 in 25 UPS, 25 MFS; (d) PD-L1 tumor, PD-L1 immune in 9 osteosarcomas
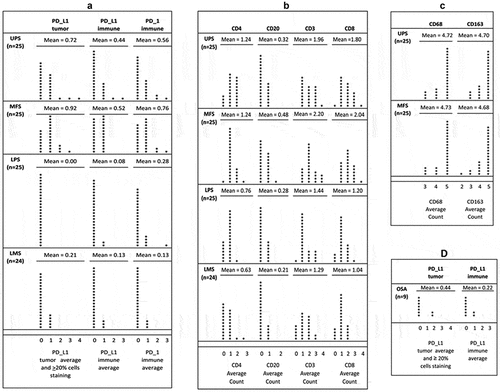
Table 3. Spearman correlations for immunohistochemical staining across STS subtypes
Figure 3. Expression of PD-L1 relative to STAM 2 in: (a) 33 UPS, (b) 57 MFS, (c) 79 osteosarcomas. RT-qPCR was performed in duplicate and the average of two independent experiments (N = 2) was utilized to calculate standard deviation and relative PD-L1 values
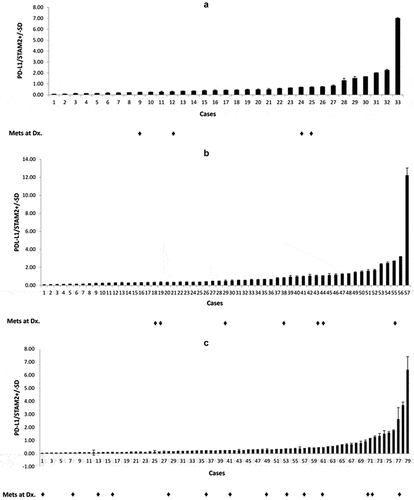
Figure 4. Scatterplot of log2 RNAseq versus log2RT-qPCR generated PD-L1 values for (a) osteosarcoma (N = 11, rho = 0.821, p-value = 0.002) and (b) soft-tissue sarcoma (N = 14, rho = 0.937, p-value = 7.7e-07)
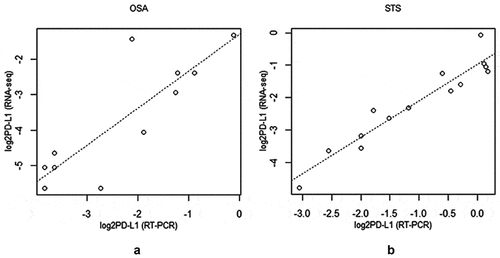
Table 4. Association between PD-L1 RNA level and clinical parameters in 29 UPS patients
Table 5. Association between PD-L1 RNA level and clinical parameters in 55 OSA patients
Table 6. Overall survival (OS) analysis by Cox proportional hazards model# for UPS patients (n = 29)
Table 7. Overall survival (OS) analysis by Cox proportional Hazards Model# for MFS patients (n = 50)
Figure 5. Kaplan–Meier overall survival (OS) curves for (a) 29 UPS cases; (b) 50 MFS cases based on PD-L1 expression high (green) versus low (red) determined by RT-qPCR
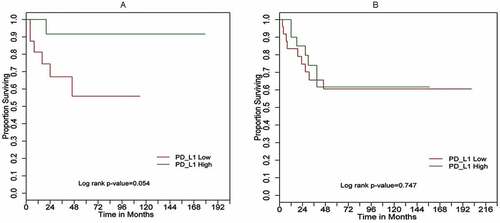
Table 8. Overall survival analysis by Cox proportional Hazards model# for 45 osteosarcoma patients
Figure 6. Kaplan–Meier overall survival (OS) curves for 55 osteosarcoma cases based on PD-L1 expression high (green) versus low (red) determined by RT-qPCR
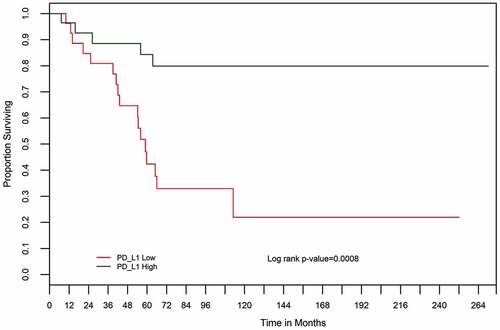
Figure 7. Distribution of the number of non-silent SSNVs (orange – missense variants; blue – nonsense variants; purple – splice site variants) identified in the coding regions of the UPS and MFS tumor genomes analyzed by DNA next-generation sequencing. The UPS and MFS tumors with high PD-L1 expression are indicated
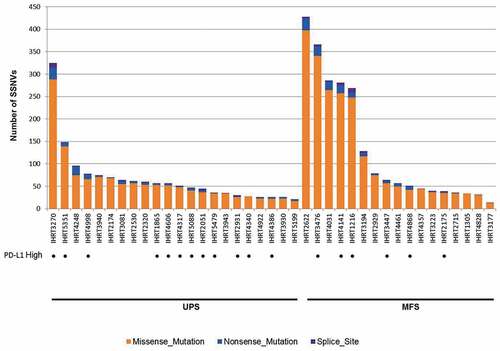
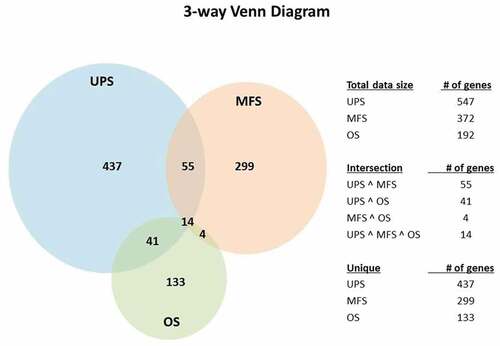
Figure 8. Venn diagrams indicating differentially expressed genes comparing PD-L1 high versus PD-L1 low expression in UPS, MFS and OSA