Figures & data
Figure 1. PD-1 is up – while PD-L1 is downregulated in peripheral blood T cells of L-CTCL patients. Percentage of PD-1, PDL-1 and PDL-2 positive cells upon staining with fluorochrome-conjugated monoclonal antibodies was assessed in double CD3- and CD4-positive cells. (a) T helper subset in L-CTCL individuals (n = 8) was characterized with significantly upregulated PD-1 expression compared to the healthy volunteers (n = 10). Representative dot blot (b) and histogram (c) demonstrate increased PD-1 expression on CD4+ T cells in blood from patients with L-CTCL, as compared to healthy donors. In contrast to PD-1, PD-L1 (d) showed decreased expression on CD4+ T cells in blood from patients with L-CTCL in comparison to healthy donors. Representative dot blot (e) and histogram (f) further visualize the lower PD-L1 expression on CD4+ T cells in L-CTCL. The percentage of peripheral blood CD4+ T cells positive for PD-L2 was low and did not differ significantly between L-CTCL patients and healthy donors (g). Mean values of percentage PD-L2 positive T lymphocytes (h) and median fluorescent intensity for the same marker (i) were in similar range for the patient and control cohort. Abbreviations: ns: P > .05; *: P ≤ 0.05; **: P ≤ 0.01; nlm: healthy donors
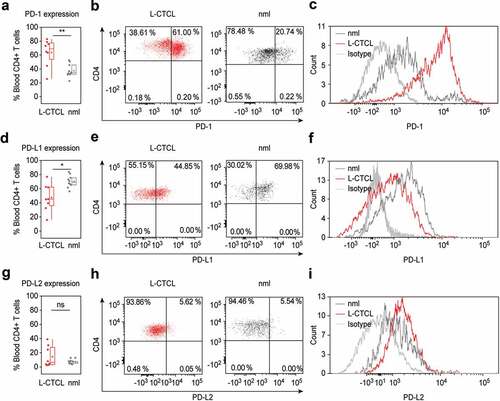
Figure 2. PD-1 is upregulated specifically on tumor T cells in the blood of L-CTCL patients. (a) Expression of PD-1, PDL-1 and PDL-2 was analyzed in malignant (clonal) compared to bystander (non-clonal) CD4+ T cells from peripheral blood of L-CTLC patients (n = 8) vs. T cells from healthy individuals (n = 10) using flow cytometry. Clonal malignant T cells were identified upon staining with T-cell receptor Vβ antibodies specific for each patient’s malignant clone. (b) and (c) Representative dot blots and histograms demonstrate the increased PD-1 expression in clonal vs. non-clonal CD4+ T cells from patients with SS. (d) Pair-wise comparison of the expression of PD-1 on clonal CD4+ T cells compared to non-clonal CD4+ T cells within the same individual patients’ blood with L-CTCL. Each color-indexed pair represents a data set from an individual patient with L-CTCL. (e) Linear regression and correlation analysis to measure the strength of association between PD-1 expressing CD4+ T cells and tumor burden, defined by % clonal T cells of all CD4+ T cells. (f) Mean fluorescent intensities (MFIs) of the stainings for PD-1 and its ligands in malignant vs. bystander and normal peripheral blood CD4+ T cells were assessed. Clonal malignant T cells were definitively identified by staining with T-cell receptor Vβ antibodies specific for each patient’s malignant clone and showed significant increase of PD-1 expression compared to the control CD4+ T lymphocytes. On the contrary, PD-L1 was downregulated in L-CTCL patients on both clonal and non-clonal CD4+ T cell subsets. Abbreviations: ns: P > .05; *: P ≤ 0.05; **: P ≤ 0.01; ***: P ≤ 0.001; nlm: health donors
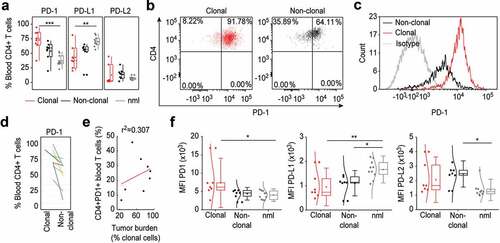
Figure 3. PD-1 expressing tumor T cells in the blood of L-CTCL patients are preferentially skin tropic. (a) CLA expression was significantly higher in L-CTCL patients (n = 8), especially within the subset of TCR Vβ clonal tumor cells compared to healthy individuals (n = 10). (b) PD-1 expressing tumor T cells were preferentially CLA positive and thus skin tropic. Abbreviations: ns: P > .05; *: P ≤ 0.05; **: P ≤ 0.01; ***: P ≤ 0.001; nlm: healthy donors
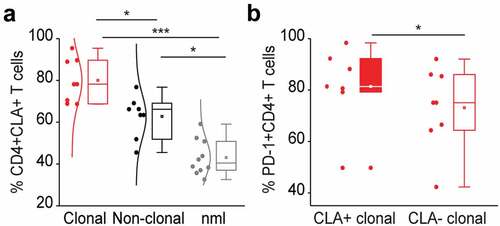
Figure 4. PD-1 is significantly overexpressed, PD-L1 significantly decreased and PD-L2 is low on T cells in the skin of patients with L-CTCL when compared with T cell population in healthy individuals. (a) PD-1, PD-L1 and PD-L2 expression analyzed by flow cytometry in skin-derived CD3+CD8− T cells isolated from biopsies of L-CTCL patients (n = 6) and healthy individuals (n = 4) using short-term explant technique. (b) Expression of PD-1, PD-L1 and PD-L2 in the tumor (clonal) and non-tumoral bystander (non-clonal) T cells from L-CTLC skin lesions. In at least one of the samples analyzed in a) and b), there was a partial aberrant loss of CD4 on the tumor cells. For consistency throughout all the samples, a gating strategy on CD3+ CD8-T cells was applied. (c) Representative images of paraffin-embedded CTCL (MF and SS) skin biopsies with high expression of PD-1 (++/≥50%), with moderate expression of PD-1 (+/5-50%), and negative for PD-1 (-/<5%). (d) Graphic visualization of PD-1 expression in CTCL skin lesions (n = 18). Evaluation of three visual fields of each slide demonstrates variable positivity for PD-1 in CTCL on immunohistochemistry. Abbreviations: ns: P > .05; ***: P ≤ 0.001; nlm: healthy donors
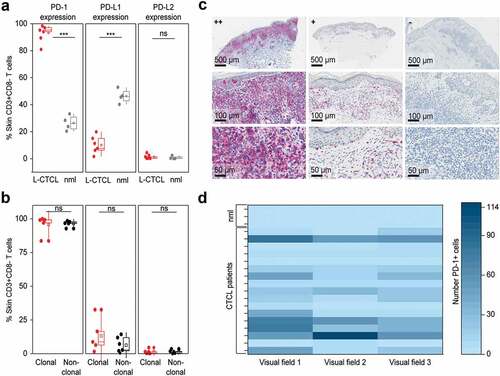
Figure 5. PD-1 blockade reduces Th2 phenotype of non-clonal bystander T lymphocytes in Sézary patients. The impact of in vitro PD-1 blockade on the Th1/Th2 phenotype of separate T cell subpopulation was evaluated by intracytoplasmic flow cytometry for IL-4 and IFN-γ. Percentage of IL-4 producing CD4+ T cells (a) and percentage of IL-4 producing CD8+ T cells (b) stimulated in the absence (blue dots) or presence (red dots) of 10 µg/mL nivolumab. Further gating demonstrates the change in percentage of IL-4 producers upon PD-1 blockade in non-clonal, bystander CD4+ T cells (c) versus clonal malignant T cells identified upon staining with T-cell receptor Vβ antibodies, specific for each individual patient, as described in Fig. 2 (d). (e–h) Distribution of IFN- γ producers amongst the same T cell fractions and stimulating conditions as described in (a-d). Data from five SS patients. Each dot represents data from one individual patient. The data obtained from the same patient are connected with dotted line
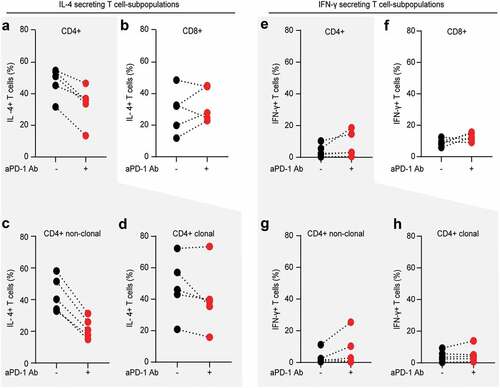
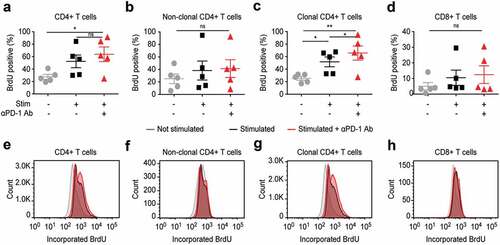
Figure 6. In vitro PD-1 blockade leads to enhanced proliferation of T cells, but affects most strongly the clonal tumor T cells in blood from SS patients