Figures & data
Figure 1. B7-H4 is expressed by bladder cancer and myeloid cells in human and murine bladder cancer. (a) Heat map of mRNAs of immune regulatory genes at 1, 2 and 4 weeks of BBN exposure. (b) Overall survival of the muscle invasive bladder cancers (MIBC) from the TCGA identifying worse survival for patients with high levels of VTCN1 (B7-H4). (c) Muscle invasive bladder cancers (MIBC, Stage II or greater) can be grouped by intrinsic tumor subtype. We performed subtype analysis of MIBCs from the TCGA and grouped them by subptype. In contrast to tumor subtype (like basal tumors) that express high levels of other immune regulatory proteins, like PD-L1, B7-H4 is more highly expressed in luminal and luminal-infiltrated tumors, (d) Immunohistochemistry of B7-H4 in normal human bladder, low grade noninvasive (stage TaLG), and invasive (Stage T1HG) demonstrating expression on tumor and infiltrating leuckocytes and in BBN mouse bladder tumor demonstrating expression only on infiltrating leukocytes (20X magnification). These localizations in human bladder cancer were confirmed by single-cell RNA-seq of a low-grade Ta tumor (e) showing high expression in luminal cells (EPCAM+) and scattered expression in myeloid cells (CD68+). Imaging mass cytometry applied to FFPE NMIBC section showing expression of B7H4 (white), smooth muscle actin (green) and pan-keratin (red). B7H4 was localized to the tumor stromal region (pan-keratin negative) (left). Same image as in (left) with the addition of CD68 (magenta) showing colocalization of B7H4 with a subset of CD68+ myeloid cells (right). Enlarged image of the indicated region in (left) with box. Enlarged image of indicated region from the right
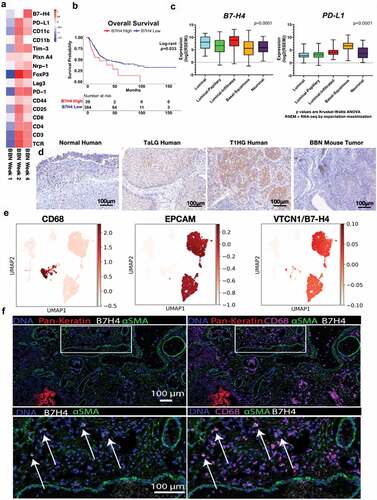
Figure 2. Bi-phasic pattern of immune bladder immune infiltration during BBN-induced cancer. Male C57BL/6 mice (n = 10 mice per group for each time point) were supplied either sterile water or sterile water containing 0.05% BBN ad libitum. On the indicated time points, 10 representative naïve control and BBN treated mice were taken for analysis. The bladders were harvested and two random bladders within each treatment group were pooled to generate a total of five analytical samples for flow cytometric analysis. The cells samples were gated as follows; for T cells (singlets, cells, live/CD45hi, CD3+/CD4+ or CD3+/CD8+ into flow plots for specified T cells markers), and for monocytes (singlets, cells, live/CD45hi, CD11b+, Ly6 C+/Ly6 G− into flow plots for specified monocyte markers). The data are presented as the mean number of each specified cell population per sample ± S.E.M. Two-way ANOVA with a Bonferroni posttest was used to determine statistical differences between naïve control and BBN-treated mice. Asterisks indicate a statistically significant difference in the number of cells present within the bladder of mice receiving BBN as compared to Control naïve mice analyzed at each time point – *p < .05, **p < .01, ***p < .001, ****p < .0001, respectively
Figure 3. Anti-B7-H4 blocks the immunosuppressive function of B7-H4Ig. Total LN cells were collected from naïve SJL/J mice, and cells were labeled with CFSE. CFSE-labeled lymph node cells (5x10⁵ cells/well) were cultured in the presence of anti-CD3 (1 µg/ml), plus Control Ig, hB7-H4Ig, anti-B7-H4, or hB7-H4Ig plus anti-B7-H4 (5 µg/ml). Replicate wells were pulsed with 1μCi of tritiated thymidine (3H-TdR) at 24 h, and the cultures were harvested on day +5. For the assessment of T cells proliferation, the percentage of live CD4 + T cells that diluted CFSE were gated. The level of cellular proliferation is also presented on each flow histogram as determined by 3H-TdR incorporation (∆ CPM = CPM with anti-CD3 – CPM with PBS) (a). SJL/J mice (n = 10/group) were primed with PLP139-151/CFA and treated with species and isotype-matched Control Ig, hB7-H4Ig, anti-B7-H4, or hB7-H4Ig plus anti-B7-H4 (100 μg/dose; 3x/wk; 2wks), and mice were followed for disease severity. The data are presented as the mean clinical score ± S.E.M. (b). On day +9 of the disease course the PLP139-151 in vivo DTH responses were assessed. The data are presented as the mean ear swelling ± S.E.M. for both control antigen challenge (OVA323-339) and specific antigen challenge (PLP139-151) (c). One representative experiment of three is presented. Two-way ANOVA with a Bonferroni posttest was used to determine statistical differences between the indicated treatment groups. Asterisks (***) indicates a statistically significant decrease in the PLP139-151-induced clinical EAE or DTH response in mice B7-H4Ig treated mice in comparison to mice treated with Control Ig, p < .001, respectively
Figure 4. Anti-B7-H4 treatment increase IFN-γ secretion by T cell cultured in the presence of B7-H4+ monocytes. CD14+ monocytes were sort purified from healthy donor PBMCs (n = 5) and cells were cultured in the presence of medium alone, IL-10, IL-6, or IL-10 plus IL-6 (10 ng/ml) for 3 days. The percent of resultant monocytes expressing B7-H4, CD80, CD86, PD-L1, and PD-L2 was assessed (a). Sort purified autologous CFSE-labeled CD4+ T cells (b, c) and CD8+ T cells (d, e) were co-cultured with IL-10 plus IL-6 conditioned monocytes and anti-CD3 for 3 days, and the level of proliferation was assessed via flow cytometry (b, d) and the level of secreted IFN-γ measured (c, e). Proliferation data is presented as the mean percent divided cells and concentration of IFN-γ (pg/ml) present with the culture ± S.E.M. Two-way ANOVA with a Bonferroni posttest was used to determine statistical differences between naïve control Ab and anti-B7-H4 treated cultures. Asterisks (**) indicates a statistically significant difference as compared to the control Ab treated cultures, p < .01, respectively
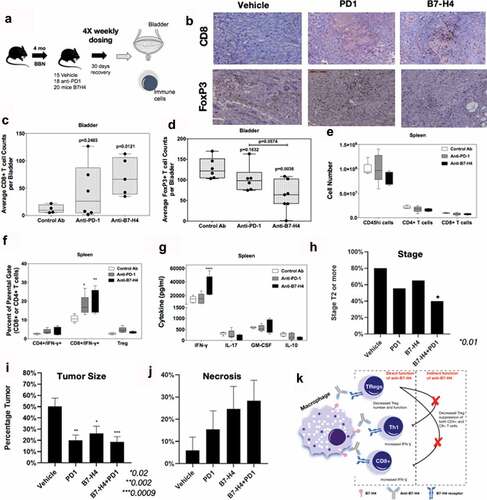
Figure 5. Anti-B7-H4 treatment increases CD8+ T cell function. (a) Treatment schema of mice for comparison of anti-tumor response of IgG, anti-PD1 and anti-B7-H4 antibodies. (b) Representative immunohistochemistry sections of BBN tumors for anti-CD8 (top) and anti-Foxp3 (bottom) staining. All images are at low-power (100X). Quantification of the average number of CD8+(c) and Foxp3+ (d) immune cells per low-power field. The number (e) and percentage (f) of singlet/live/CD45hi cell that were CD4+/IFN-γ+, CD8+/IFN-γ+, or CD4+/CD25+/Foxp3+ present within the spleens was assessed by flow cytometry. The data are presented as the mean cell number or percentage of cells ± S.E.M. Total splenocytes were cultured in the presence of anti-CD3 (1 μg/ml) for 3 days and the level of secreted cytokine assessed. The data are presented as the mean pg/ml of secreted cytokine (g). Two-way ANOVA with a Bonferroni posttest was used to determine statistical differences between the indicated treatment groups. Asterisks (*, **, ****) indicates a statistically significant difference as compared to the control Ab-treated mice, p < .05, 0.01, 0.001, respectively. (h) BBN mice treated with anti-PD-1 and anti-B7-H4 had lower rates of T2 or higher (detrusor muscle invasion and greater) cancer compared to anti-PD1 or anti-B7-H4 alone. (i) Tumor area/bladder section (expressed a percentage of bladder section) was compared from mice with different treatments (j) Tumor necrosis (expressed as a percentage of necrosis/tumor area) was also compared between treatment types. (k) Mechanistic cartoon of proposed function B7-H4 and blockade of B7-H4 by antibody in bladder cancer