Figures & data
Figure 1. The REAL-neo pipeline
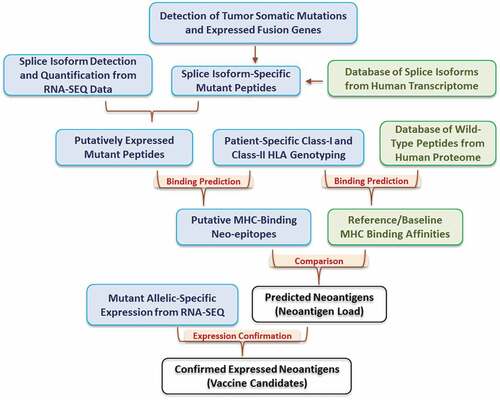
Figure 2. HLA genotyping and neoantigen profiling in 835 TCGA BRCA tumors. (a) The number of unique HLA genotypes in the 835 TCGA BRCA patients. (b) Distribution of the number of class-I and class-II HLA genotypes per patient. (c) Total number of neoantigens in the BRCA cohort, stratified by: (i) type of somatic mutations: SNM, INDEL, and gene fusion from which neoantigens arose; and (ii) the class of HLA molecules neoantigens bind to. (d) The numbers of class-I (top panel) and class-II (bottom panel) neoantigens per patient, stratified by somatic mutation types of SNM, INDEL and Fusion. The x-axis is in Log2 scale
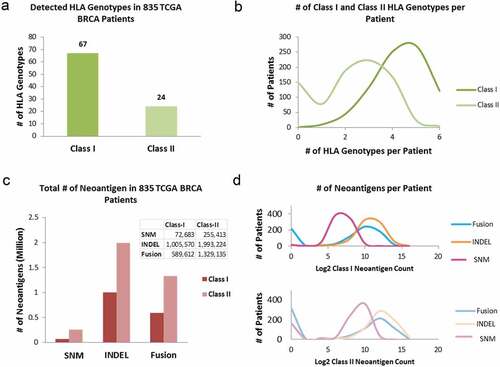
Figure 3. (a) The correlation between log2-transformed tumor mutation burden and neoantigen load per case in 835 TCGA BRCA tumors. Each dot represents a sample. The oval circle represents normal confidence ellipses. The Pearson correlation coefficient and the corresponding p-value were used to measure the strength of a linear association between TMB and neoantigen load. (b) The correlations between log2-transformed TMB and class-I neoantigen load, stratified by type of somatic mutations: SNM (pink), INDEL (orange) and fusion (blue). (c) The correlations between log2-transformed TMB and class-II neoantigen load, stratified by SNM (purple), INDEL (brown) and fusion (green). (d) The distribution of binding affinities between neoantigens and class-I HLA measured by IC50 (nM), stratified by SNM (pink), INDEL (orange) and fusion (blue). Smaller IC50 values indicate stronger bindings between neoantigens and HLA. (e) The distribution of binding affinities between neoantigens and class-II HLA (SNM in purple, INDEL in brown, and fusion in green)
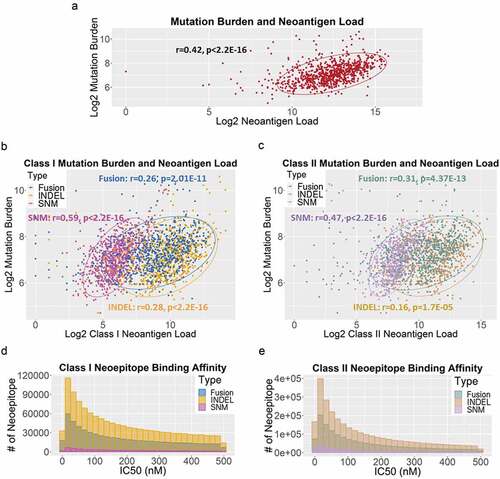
Figure 4. Neoantigen recurrence in the TCGA BRCA patients. (a) The occurrences of class-I (brown box) and class-II (green box) neoepitopes in 1, 2–5 (<0.6%), 6–9 (0.6%-1%), 10–17 (1%-2%), 18–42 (2%-5%), and >42 (>5%) patients. For neoepitopes that occurred in >1% cohort, the numbers of recurrent neoepitopes were followed by the numbers of genes they affected. (b) The peptide sequences, number of recurrence among patients, gene names and mutation types of the 18 neoepitopes that occurred in >42 patients
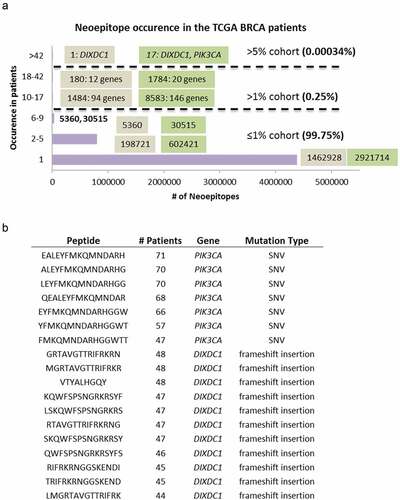
Table 1. Neoantigens in BRCA driver genes
Figure 5. Neoantigen load and BRCA1/2 mutation status, BRCA subtypes and immune subtypes. (a) BRCA1 and BRCA2 mutation status and overall mutation burden. Left panel: patients with known deleterious BRCA1 or BRCA2 germline mutations (labeled as Mutated, dark purple) had suggestive higher overall mutation burden than patients without (labeled as WT, light purple) (p = .067). Right panel: patients with known deleterious BRCA1 or BRCA2 germline and somatic mutations (labeled as Mutated, dark blue) had significantly higher overall mutation burden than patients without (labeled as WT, light blue) (p = 2.67E-06). (b) BRCA1 and BRCA2 mutation status and neoantigen load. Left panel: patients with known deleterious BRCA1 or BRCA2 germline mutations (labeled as Mutated, dark yellow) did not show significant difference in neoantigen load from patients without (labeled as WT, light yellow). Right panel: patients with known deleterious BRCA1 or BRCA2 germline and somatic mutations (labeled as Mutated, dark green) had significantly higher neoantigen load than patients without (labeled as WT, light green) (p = .009). (c) Breast cancer subtype and neoantigen load. Significant differences in neoantigen load were found between Basal and LumA (p = 4.04E-05), Her2 and LumA (p = .005), LumA and LumB (p = 4.31E-06), and LumA and Normal (p = .0003). (d) Immune subtype and neoantigen load. Significant differences in neoantigen load were found between C1 and C3 (p = .01), C2 and C3 (p = .001), and C1 and C6 (p = .03)
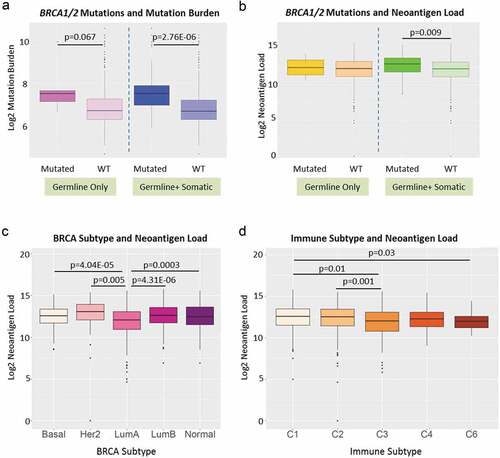
Figure 6. Neoantigen load and race in stratified age groups and breast cancer subtypes. (a) Neoantigen load of patients in pre-menopausal stage (ages 26–44) in Asian (red), Black (green) and White (blue) races separated by Basal, Her2, LumA and LumB subtypes. There is no significant difference among races in any breast cancer subtype. (b) Neoantigen load of patients in peri-menopausal stage (ages 45–54) in Asian (red), Black (green) and White (blue) races separated by Basal, Her2, LumA and LumB subtypes. White had significantly higher neoantigen load compared to Asian in Her2 subtype (p = .0033); both black and white patients had higher neoantigen loads in LumB subtype compared to Asian (p = .037 and p = .04, respectively). (c) Neoantigen load of patients in post-menopausal stage (ages 55–90) in Asian (red), Black (green) and White (blue) races separated by Basal, Her2, LumA and LumB subtypes. White patients had significantly higher neoantigen load than Asian in Basal (p = .0057) and LumB subtypes (p = .0052); both black and white patients had higher neoantigen loads compared to Asian in LumA subtype (p = .037 and p = .0097, respectively)
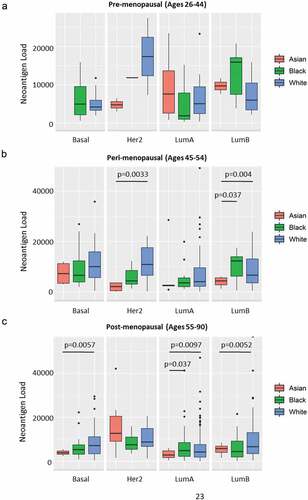
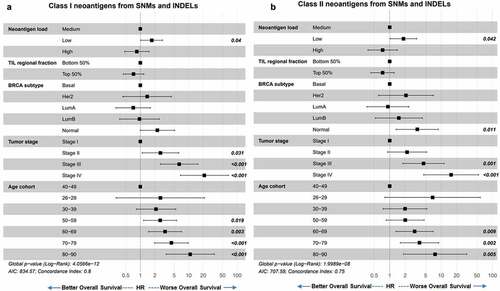
Figure 7. Neoantigen load from SNM and INDEL predicts overall survival. (a) Overall survival of BRCA patients separated by low (bottom 25%), medium (middle 50%) and high (top 25%) class I SNM and INDEL neoantigen load. When corrected for immune filtration, tumor stage, breast cancer subtype, and age at diagnosis using the Cox proportional hazard models, low neoantigen load showed significantly worse survival than medium neoantigen load (p = .04). (b) Overall survival of BRCA patients separated by low (bottom 25%), medium (middle 50%) and high (top 25%) class II SNM and INDEL neoantigen load. When corrected for immune filtration, breast cancer subtype and age cohort using the Cox proportional hazard models, low neoantigen load showed significantly worse survival than medium neoantigen load (p = .042)