
Figures & data
Table 1. Study characteristics
Table 2. Information on primary outcome of the studies included in network meta-analysis
Figure 1. Flow chart of study selection
Figure 2. Network structure for all the included trials. Each circular node represents a treatment type. The circle size is proportional to the total number of patients. The width of lines is proportional to the number of studies performing head-to-head comparisons in the same study, and the dotted line is the indirect comparison which was shown in this NWM
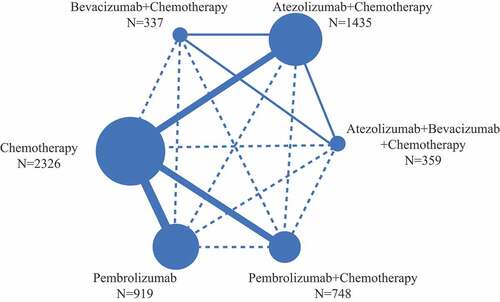
Figure 3. ORR, PFS, and OS profiles for study cohort in the subgroup analysis based on PD-L1 expression. PD-L1-high (a,b), PD-L1-intermediate (c,d) and PD-L1-negative (e,f) subgroup analysis according to network meta-analysis (NMA). Each cell contains the pooled odds ratios (OR) and 95% credibility intervals for ORR, and the Hazard-Radio (HR) and 95% credibility intervals for PFS and OS; significant results are emboldened
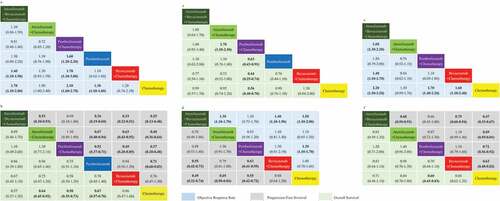
Figure 4. PFS and OS comparison profiles for non-squamous NSCLC under subgroup analysis are based on PD-L1 expression. PD-L1-high (a), PD-L1-intermediate (b) and PD-L1-negative (c) subgroup analysis according to network meta-analysis (NMA). Each cell contains the Hazard-Radio (HR) and 95% credibility intervals for PFS and OS; significant results are emboldened
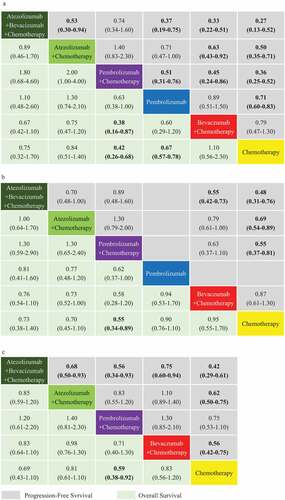
Figure 5. ORR, PFS, and OS comparative profiles for PD-L1-high squamous NSCLC according to network meta-analysis (NMA). Each cell contains the pooled odds ratios (OR) and 95% credibility intervals for ORR (a), and the Hazard-Radio (HR) and 95% credibility intervals for PFS and OS (b); significant results are emboldened
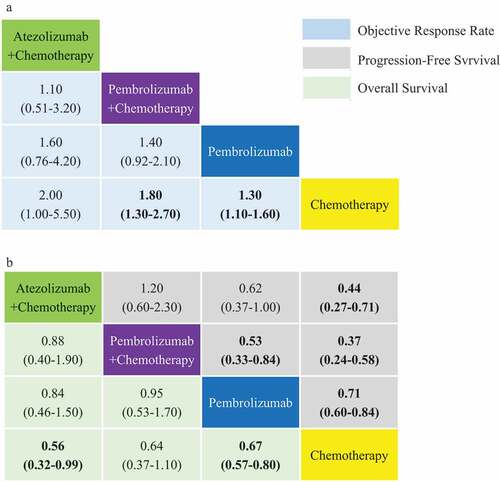
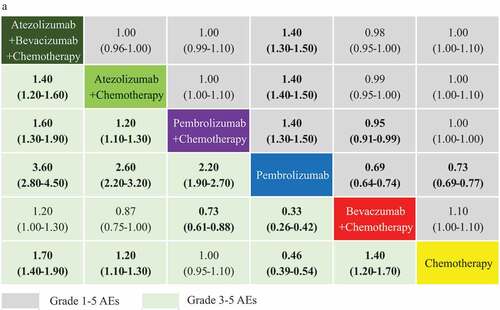
Figure 6. Incidence of grade 1–5 AEs and grade ≥3 AEs comparative profiles according to network meta-analysis (NMA). Each cell contains the pooled odds ratios (OR) and 95% credibility intervals for the incidence of AEs; significant results are emboldened. AEs: adverse events AE
Supplemental Material
Download ()Availability of data and materials
All data generated or analyzed during this study are included in this published article and its supplementary information files.