Figures & data
Figure 1. RHOA p.Gly17Val transgenic mice develop asymmetric lymphadenopathy. (a) A schematic diagram of transgene expression vector. Blue arrowheads indicate oligonucleotide primers for genotyping. (b) RT-PCR analysis shows that the transgene is most highly expressed in CD4+CD8− population. The graph on the right side shows results from three independent real-time RT-PCR analyses as means ± S.D. (*) and (**) represent P-values < 0.05 and <0.01, respectively. (c) Immunoblotting for RHOA protein. Note HA-tagged RHOA is seen only in the transgenic mice. Tubulin was used as loading control. (d) Asymmetric lymphadenopathy is seen in virtually all transgenic mice after a prolonged latency. A lymph node from 20-month-old mouse is seen next to a lymph node from an age-matched littermate wild type control mouse. Lymph node sizes of transgenic mice grouped into indicated age brackets. Note the significant increase in the 7–8 month group. (*) represents P-value < 0.05 from t-test. (e) Life span is significantly shortened in RHOA p.Gly17Val transgenic mice. P-value < 0.05 from log-rank test.
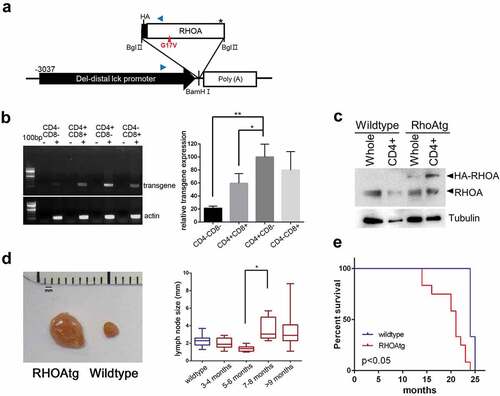
Figure 2. Histopathology of enlarged RHOA p.Gly17Val transgenic lymph nodes. (a, b) A lymph node from wild type mouse shows lymphoid aggregates in the cortex without germinal centers. The boxed region in A is shown in an enlarged form in B. (c, d). A lymph node from mutant mouse shows mixed cortical and paracortical hyperplasia with lymphoid follicles with germinal centers (GC). The boxed region in C is shown in an enlarged form in D. (e) The medullary area of lymph node is infiltrated by numerous plasma cells with readily recognizable morphology (see the higher magnification inset; also see supplementary material, Figure S2). (f, g) Occasionally, neutrophil infiltration (F and inset) and immunoblasts (G and arrow) are noted. (h-l) Immunoarchitecture of lymph node is shown by PAX5 (h), CD3 (i, j) and CD4 (k, l) staining. The boxed regions in I and K are shown in enlarged forms in J and L, respectively. (m–r) Sections from transgenic lymph nodes were also stained for PD-1 (m, n, q) and CD21 (o, p, r). The boxed regions in M and O are shown in enlarged forms in N and P, respectively. The region with asterisks in M and O are shown in enlarged forms in Q and R, respectively. Germinal center (arrow) is highlighted by nodular aggregates of CD21+ cells with dendritic pattern (o, p). PD-1+ cells are frequently observed in interfollicular area as well as within germinal center (m, n, q). Of note, CD21+ cells are also observed in extra-germinal center area (asterisks; O, R), where PD-1+ cells are also present (asterisks; M, Q). (s, t) Sections from transgenic lymph nodes are stained with MECA79 antibody specific for HEV. The boxed region in S is shown in enlarged forms in T. Scale bars represent: 10 μm for G; 50 μm B, E, F, J, L, Q, R, and T; 100 μm for D, H, N, and P.; 200 μm for A, M, O, and S; 500 μm for C, I and K.
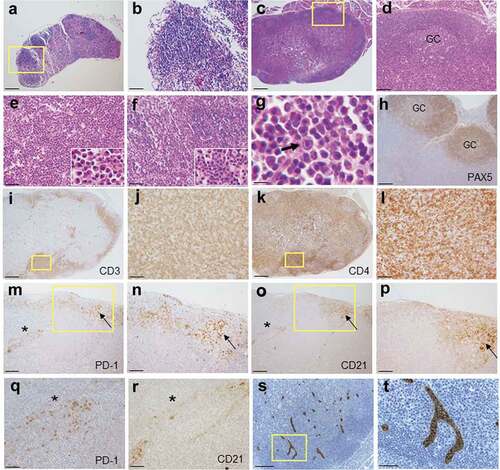
Figure 4. T-cell clonality and B-cell expansion in RHOA p.Gly17Val mice. (a-d) Sections from wild type (a, b) and transgenic (c, d) lymph nodes are stained with anti-CD3 antibody. The boxed regions in A and C are shown in enlarged forms in B and D, respectively. Note the scattered T-cells seen outside follicles in the wild type lymph node and the large clusters of T-cell colonies in the enlarged transgenic lymph node. (e) Lymph nodes from 3 litter mate pairs of wild type (WT) and transgenic (TG) mice were used for examination of TCR β chain diversity. 5ʹRACE PCR amplification of rearranged TCR β chain was carried out with oligonucleotide primers corresponding to the constant region. Products ranging from approximately 350 to750 bps in length were expected. Gene Scan results are consistent with oligo-clonality for affected transgenic lymph nodes. Wild type (f, g) and enlarged transgenic (h, i) lymph nodes were stained with anti-PAX5 antibody. The boxed regions in F and H are shown in enlarged forms in G and I respectively. Note the restricted localization of B-cells within the follicle in the wild type lymph node and scattered B cell clusters throughout the affected lymph node of the transgenic mouse. (j) Proportions of B cell are higher in the enlarged transgenic lymph nodes. Histograms from flow cytometric analyses using anti-CD19 are shown. The graph on the right side shows results from independent mouse samples. (**) represents P-value < 0.01 from t-test. (k) Results from ELISA show approximately two-fold increase in the serum IgG level in transgenic mice. (*) represents P-value < 0.05 from t-test. Scale bars represent: 50 μm for B, D, G, and I; 200 μm for A, C, F, and H.
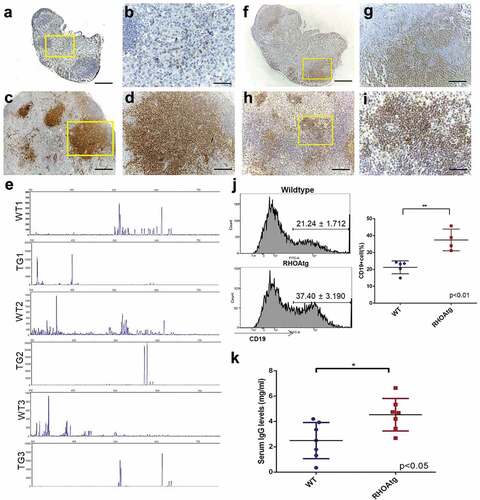
Figure 3. Increase in the number of Tfh cells in the enlarged transgenic lymph nodes. (a) The proportions of Tfh cells among helper T-cells were determined using the lymph nodes from wild type and transgenic mice. CD4+ B220- CD11b-cells were analyzed for the expression of PD-1 and CXCR5 following the protocol described in Baumjohann and Ansel, Nat. Protoc., doi.org/10.1038/protex.2013.060. Note the significant increase in PD-1+ CXCR5+ Tfh cells in the affected transgenic lymph nodes. Graph on the right side summarizes results from multiple samples (n = 6). (*) represents P-value <0.05 from t-test. (b) Heatmap representation of Tfh-associated markers in CD4 + T cells from WT and RHOA p.Gly17Val transgenic mice. (c) Gene set enrichment analysis indicates enrichment of Tfh signature.
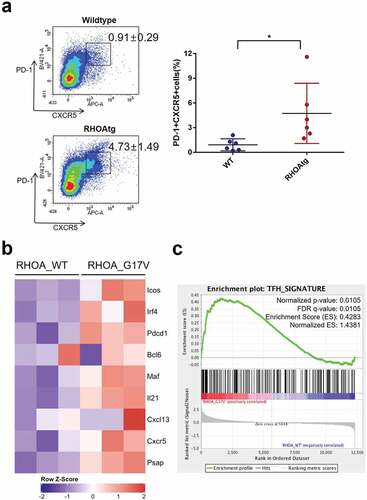
Figure 5. Histopathology of NSG mouse lymph node transplanted with enlarged lymph node cells from RHOA p.Gly17Val mouse. (a, b) H&E staining of single enlarged lymph node from transplanted NSG mouse. Note lymphocytic infiltration. (c) CD3 staining shows presence of T cells. (d) PAX5 + B cells are missing. (e) CD4+ cells are found. (f) HA staining shows presence of transgenic cells. PD-1 staining (g) and CD21 staining (h) are consistent with partial replication of original transgenic phenotype. Scale bars represent: 200 μm for A; 50 μm for the rest.
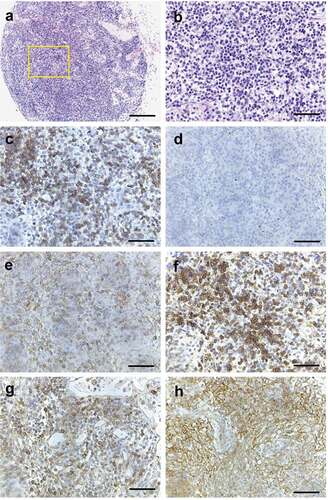
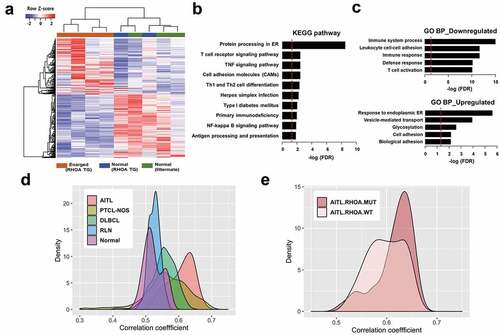
Figure 6. Expression correlation analyses of RHOA p.Gly17Val transgenic mice. (a) Heatmap view of RNA-seq data for mouse tissues using differentially expressed genes (DEGs) comparing four affected transgenic samples (i.e., enlarged lymph nodes), two unaffected transgenic samples and three control samples (from litter mates). (b, c) Gene set analysis by WebGestalt for statistical enrichment of 701 DEGs in KEGG pathways and Gene Ontology (GO) biological processes. Red vertical lines represent the FDR threshold of 0.05. (d) Distribution of pairwise correlation coefficients of 4 RHOA p.Gly17Val transgenic mice with 33 AITL patient tumors, 68 PTCL-NOS patient tumors, 203 DLBCL patient tumors, 12 reactive lymph nodes (RLN), and 20 normal T cell samples. Note the highest correlation between RHOA transgenic mice and AITL patients. The P-values for AITL vs PTCL-NOS, AITL vs DLBCL, AITL vs RLN and AITL vs Normal comparisons were = 1.47e-12, < 2.2e-16, < 2.2e-16 and < 2.2e-16, respectively, according to the Wilcoxon rank sum test. (e) Distribution of pairwise correlation coefficients of RHOA p.Gly17Val transgenic mice with 14 and 13 AITL patients with and without RHOA p.Gly17Val mutation, respectively. Note the higher correlation with patients with the mutation (P-value of 2.97e-3).