Figures & data
Table 1. Characteristics of patients with non-small cell lung cancer according to CD200 and CD200R1 expression
Figure 1. Mutual correlations between CD200 and CD200R1 expression and their associations with tumor-infiltrating lymphocytes (TILs)
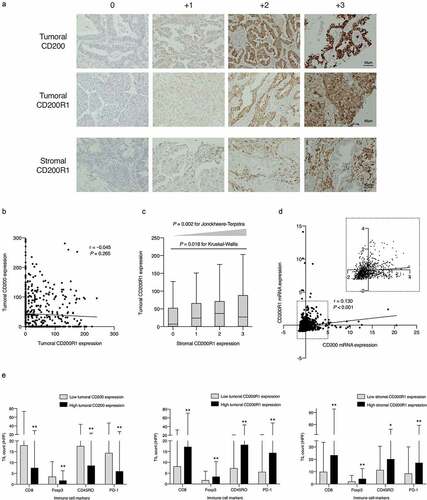
Table 2. Multivariate Cox hazards models of survivals in all patients with non-small cell lung cancer
Figure 2. Survival analysis according to CD200 or CD200R1 expression in patients with non-small cell lung cancer (NSCLC)
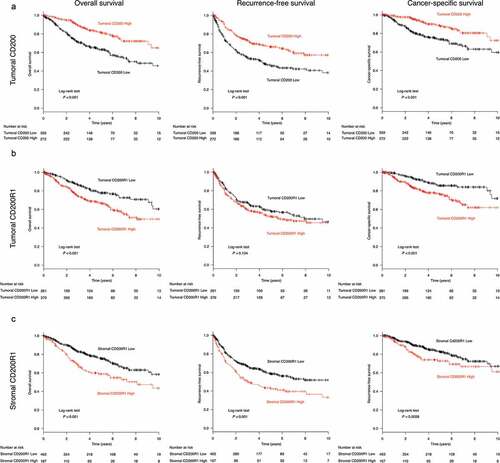
Figure 3. CD200 and CD200R1 expression profiles in lung cancer cell lines and effect of CD200 knockdown
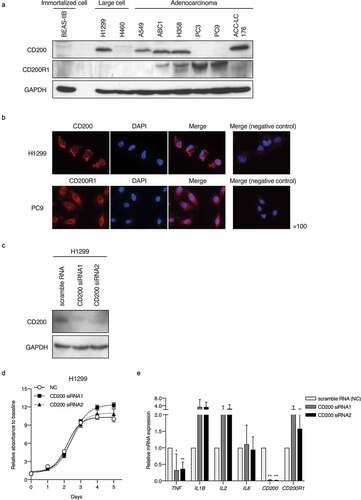
Figure 4. Evaluation of CD200R1 functions with CD200R1 knockdown and CD200Fc administration
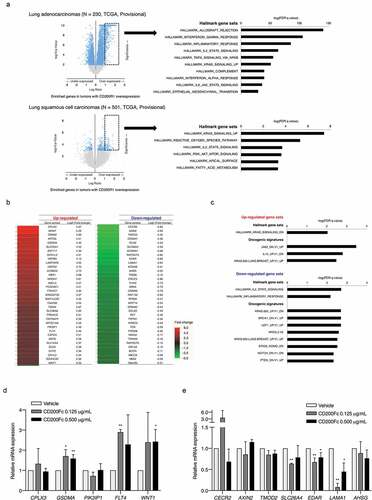
Figure 5. Enriched gene profiles in tumors with high CD200R1 expression and differentially-expressed genes in response to CD200Fc administration as assessed by cDNA microarray