Figures & data
Figure 1. Summary of clinical information and tumor immune microenvironment. (a) We developed tissue array of 117 HCC patients and summarized clinical characteristics. Each patient has more than 5-year follow-up. (b) Opal multicolor IHC staining with anti-CD8, anti-CD4, anti-PD-1, FOXP3 antibodies, and DAPI. (c) Comparison of CD8+, CD8+PD-1+, CD4+, CD4+PD-1+ and CD4+FOXP3+ expression between ANT and TM
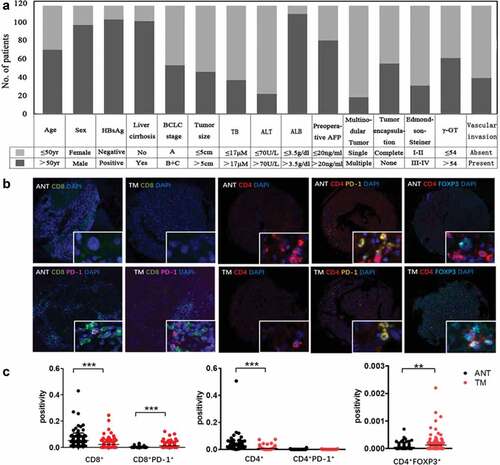
Figure 2. OS curves from ANT and TM in HCC. OS curves were plotted in GraphPad Prism 5. The horizontal axis showed time after surgery and the vertical axis showed overall survival rates by the corresponding time. Two sets of data (low vs. high) were represented by black and red curve, respectively. P < .05 was considered statistically significant. OS, overall survival; ANTlow, low expression of indicated biomarkers in ANT; ANThigh, high expression of indicated biomarkers in ANT; TMlow, low expression of indicated biomarkers in TM; TMhigh, high expression of indicated biomarkers in TM; ANT+TMlow, low expression of indicated biomarkers in both ANT and TM; ANT+TMhigh, high expression of indicated biomarkers in both ANT and TMTTR curves from ANT and TM in HCC TTR curves were plotted in GraphPad Prism 5. The horizontal axis showed time after surgery and vertical axis showed probability of recurrence. Two sets of data (low vs. high) were represented by black and red curve, respectively. P < .05 was considered statistically significant. TTR, time to recurrence; ANTlow, low expression of indicated biomarkers in ANT; ANThigh, high expression of indicated biomarkers in ANT; TMlow, low expression of indicated biomarkers in TM; TMhigh, high expression of indicated biomarkers in TM; ANT+TMlow, low expression of indicated biomarkers in both ANT and TM; ANT+TMhigh, high expression of indicated biomarkers in both ANT and TM
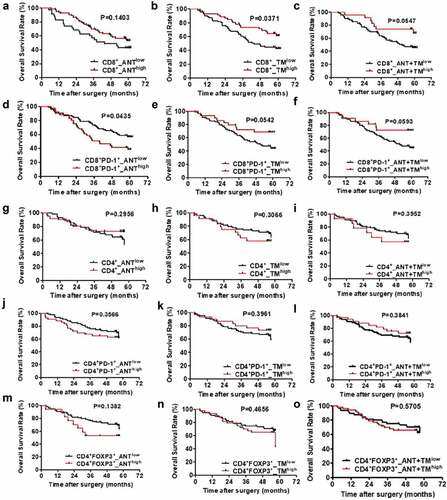
Figure 3. TTR curves from ANT and TM in HCC
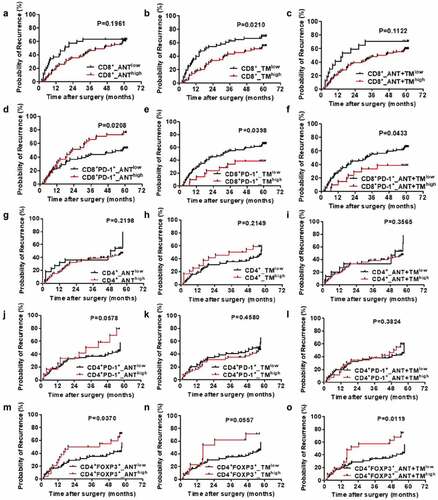
Figure 4. Clustering tumor-infiltrating T cells in ANT and TM of HCC
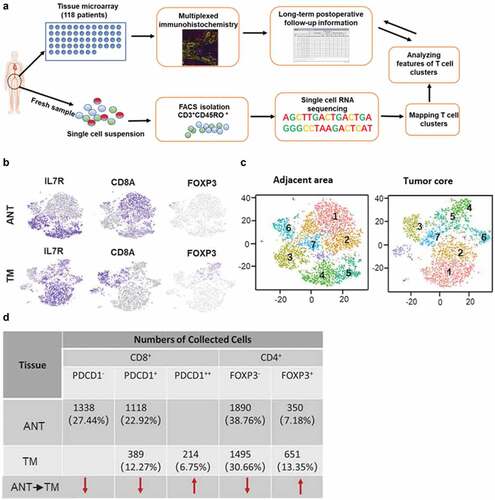
Figure 5. T cell subtype analysis of ANT based on single-cell gene expression (a) Seven stable T cell clusters, corresponding signature genes, and functional description of ANT. (b) Violin plots showing the expression profile of multiple inhibitory receptors, cell markers, and effector molecules in each cluster corresponding to the ANT. Each violin plot shows both distribution and density of the indicated gene. (c) Heatmap of top selected genes among seven clusters of ANT
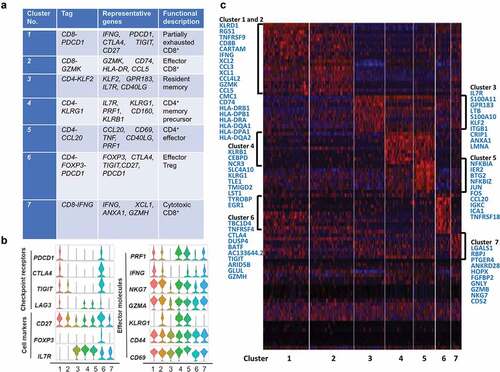
Figure 6. T cell subtype analysis of TM based on single-cell gene expression (a) Seven T cell clusters, corresponding signature genes and functional description of TM. (b) Violin plots showing the expression profile of multiple inhibitory receptors, cell markers, and effector molecules in each cluster corresponding to the TM. Each violin plot shows both distribution and density of the indicated gene. (c) Heatmap of top genes in each cluster of ANT
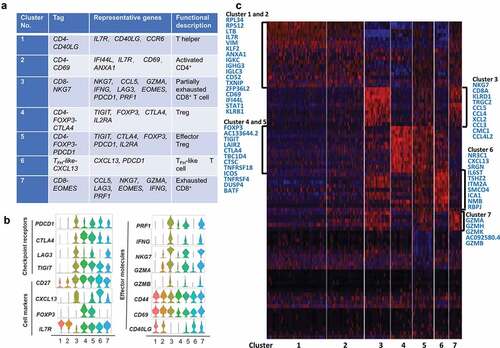
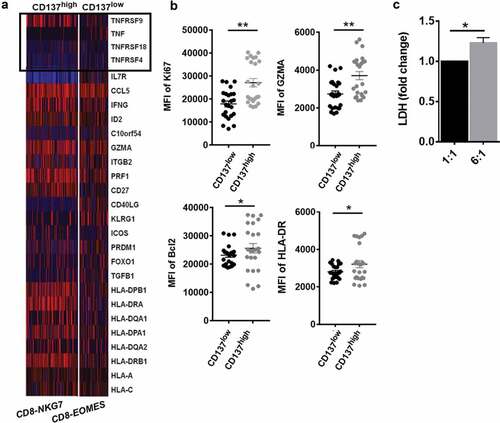
Figure 7. CD137 enriched CD8+T cell with superior effector function in HCC TM (a) Heatmap of scRNA showing differentially expressed genes of tumor necrosis factor (TNF) and TNF-receptor superfamily. (b) The comparison of CD137highCD8+T cell and CD137lowCD8+T cell including Ki67, GZMA, HLA-DR, and Bcl2 from tumor tissue of HCC patients was analyzed through flow cytometry. (c) The cytotoxicity of CD137 activated CD8+T cells. CD137 CART cells were co-cultured with cancer cell line H226, with cell ratios of 1:1, 6:1, respectively. After 24 h, the supernatant was collected and detected by using pierce LDH cytotoxicity assay kit. P < .05 was considered statistically significant. *, P < .05; **, P < .01