Figures & data
Figure 1. Identification of tumor-infiltrating IL-17A+ cells in muscle-invasive bladder cancer. (a) Representative immunochemistry staining of IL-17A+ cells in muscle-invasive bladder. (b) A fraction of patients with high/low IL-17A+ cells in different TNM stages. (c) The number of tumor-infiltrating IL-17A+ cells in different TNM stages. (d) Representative flow cytometry analysis of the surface markers expressed by IL-17A+ cells from fresh human muscle-invasive bladder cancer samples. (e) Quantification analysis of surface markers expressed by tumor-infiltrating IL-17A+ cells
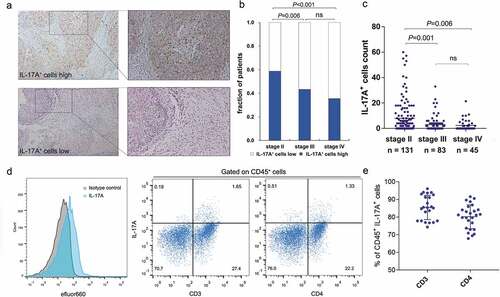
Figure 2. Tumor-infiltrating IL-17A+ cells and IL-17A mRNA indicate better survival for patients. (a and b) Kaplan–Meier curves comparing OS and RFS in muscle-invasive bladder cancer patients with high and low tumor-infiltrating IL-17A+ cells/IL-17A mRNA. (c and d) Multivariate cox regression analysis for IL17A expression and clinic-pathological variables
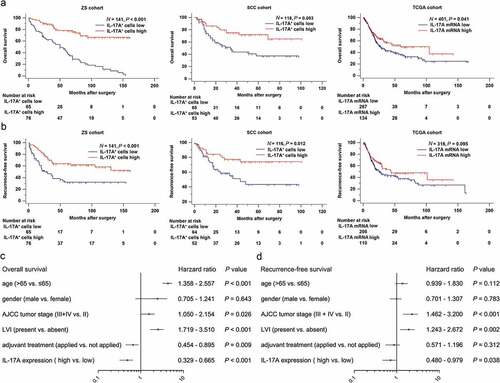
Figure 3. Tumor-infiltrating IL-17A+ cells indicate an improved therapeutic response to adjuvant chemotherapy. (a and b) Survival curves for the use of adjuvant chemotherapy (ACT) in all patients, (c and d) in patients with low intra-tumoral IL-17A+ cells, (e and f) and in patients with high intra-tumoral IL-17A+ cells
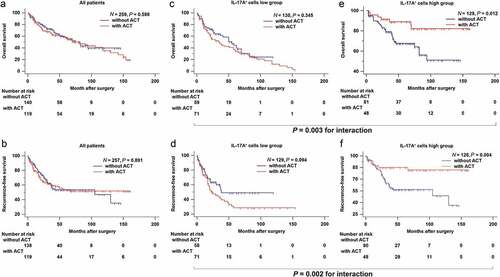
Figure 4. Association of IL-17A+ cells and various tumor-infiltrating immune cells. (a) Representative immunochemistry staining of B cells, Dendritic cells and CD8+ T cells in IL-17A+ cells high tumors and in IL-17A+ cells low tumors. (b) Pearson correlation analysis of IL-17A+ cells with other tumor-infiltrating lymphocytes. (c) Differences in tumor-infiltrating lymphocytes between IL-17A+ cells high tumors and IL-17A+ cells low tumors
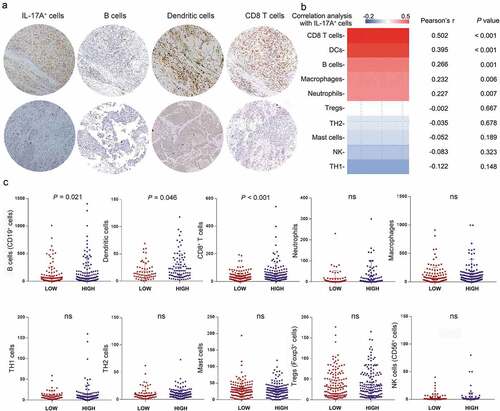
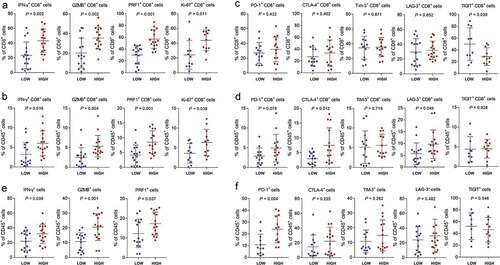
Figure 5. Tumor-infiltrating IL-17A+ cells indicate enhanced anti-tumor immunity. (a) Difference in effector cytokines and proliferation marker expressed by CD8+ T cells in IL-17A+ cells low tumors and IL-17A+ cells high tumors. (b) Proportion of CD8+ T cells expressing effector cytokines and proliferation marker in CD45+ cells. (c) Difference in immunosuppressive molecules expressed by CD8+ T cells. (d) Proportion of CD8+ T cells expressing immunosuppressive molecules in CD45+ cells. (e and f) Effector cytokines and immunosuppressive molecules expressed by CD45+ cells in IL-17A+ cells low tumors and IL-17A+ cells high tumors