
Figures & data
Figure 1. Flow chart of the 3520 articles initially selected, 49 were included after full-text screening. (Moher et al. 2009. prisma flow chart).Citation98.
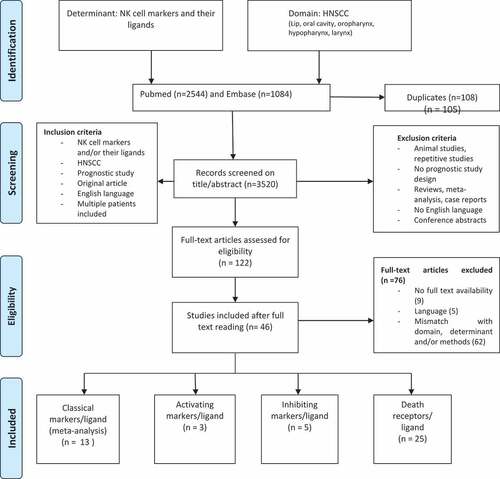
Table 1. Quality assessment of the classical marker studies. Total bias score excluded study attrition
Figure 2. Forest plot of prognostic value of CD56+/CD57+ NK cells on overall survival; high CD56/CD57 cell count correlated with better overall survival (HR 0.19, CI 0.11–0.35). (RevMan 2014).Citation99.
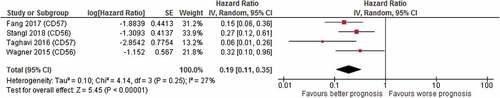
Table 2. The outcomes of activating and inhibiting marker studies are summarized based on high expression of the markers in question. Oral Cavity (OC), Oropharynx (OP), Hypopharynx (HP), Larynx (L), Lip (Lip), Tongue (T). Overall survival (OS), Disease-free survival (DFS), Progression-free survival (PFS), Distant metastasis-free survival (DMFS), Disease-specific survival (DSS), Local recurrence (LR), Local-regional control (LRC)
Table 3. The outcomes of death receptor studies are summarized based on high expression of the markers in question. Oral Cavity (OC), Oropharynx (OP), Hypopharynx (HP), Larynx (L), Lip (Lip), Tongue (T). Overall survival (OS), Disease-free survival (DFS), Progression-free survival (PFS), Distant metastasis-free survival (DMFS), Disease-specific survival (DSS), Local recurrence (LR), Local-regional control (LRC)