
Figures & data
Figure 1. Generation and characterization of anti-CD19 scFv fusion protein
(a, b) Lysates of OrigamiB(DE3)pLysS cells transfected with expression plasmids for CD19-scFv-D4, CD19–scFv, and her-2/neu D4. After transfection, the proteins were purified, and western blotting was performed using Abs against His-Tag (a) and her-2/neu (b).(c) For in vitro B cell binding, splenocytes were incubated with biotin-labeled scFv, D4, and scFv–D4, followed by anti-mouse B220 and streptavidin. Cells were washed and assessed by flow cytometry. For in vivo binding, biotin-labeled proteins were i.v. injected into mice. Peripheral blood was drawn 10 min after injection. Cells were stained with anti-mouse B220 and streptavidin and assessed by flow cytometry.(d) B cells were stimulated with fusion proteins, as indicated, for 24 h. Surface molecules CD80, CD86, and MHCII were assessed by flow cytometry. Data shown are representative of three independent experiments. B cells were stimulated with fusion proteins. A summary of CD80, CD86, and MHCII mean fluorescence intensity (MFI) is shown in the bar graph. ***p < .0001, *p < .05.
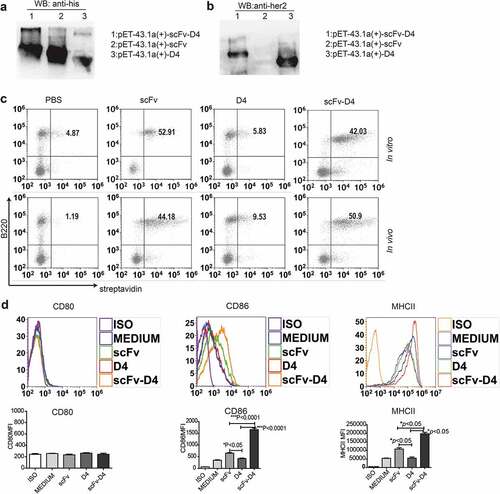
Figure 2. CD19-mediated Ag targeting of B cells induces antibody and T cell responses
(a, b) Mice (n = 5) were immunized with scFv, D4, or scFv–D4 (50 μg per mouse) three times at 1-week intervals; mice were bled at day 21. The sera were assessed for her2/neu–specific Abs by ELISA (a). Anti-her2/neu-specific Ab competitive inhibition assay showing that sera (1:10) from mice immunized with scFv-D4 are capable of inhibiting Herceptin-mediated binding. Percentage of inhibition is shown (b).(c) BALB/c mice (n = 3) were immunized with scFv, D4, or scFv–D4 three times at 1-week intervals. Splenocytes were harvested at day 21 and stimulated with scFv–D4 for 3 d. Assessment of intracellular production of IFN-γ by CD4+ and CD8+ T cells (c).(d) Splenocytes from immunized mice with scFv-D4 were harvested, the B cells were removed by CD19 beads, and then splenocytes with or without B cells (B cell-depleted) were stimulated with scFv–D4 for 3 d. Intracellular production of IFN-γ by CD4+ T cells is shown (d).(e) Graph showing body weight of BALB/c mice (n = 5) as a measure of systemic fusion protein toxicity.Data are representative of three experiments. Error bars represent standard error of the mean **p < .01, *p < .05.
Figure 3. Targeting Ags to B cells induces anti-tumor activity in a 4T1/E2 breast cancer model
(a) Schematic representation of subcutaneous (s.c.) 4T1/E2 tumor cell treatments applied to BALB/c mice.(b, c) BALB/c mice (n = 7) were challenged s.c. with 106 4T1/E2 tumor cells. The mice were treated with scFv, D4, or scFv–D4 three times at 1-week intervals when the tumor size (diameter) reached 3–5 mm. Tumor growth (b) and survival (c) were recorded.(d, e) BALB/c mice (n = 5) with established 4T1/E2 tumors were treated with scFv-D4, as described in ). Tumors were isolated on day 26, and immune cells were analyzed by flow cytometry. Shown are the numbers of tumor-infiltrating (d) CD45+CD3+CD8+ T cells and (e) CD45+ CD11b+Gr1+ cells in the different treatment groups.(f–h) Tumors were isolated on day 26, and tumor-infiltrating lymphocytes (TILs) from the tumors were stimulated with PMA and ionomycin in the presence of brefeldin A for 4 h. Intracellular production of IFN-γ by CD4+ (f) and CD8+ T cells (g) is shown. The percentage of myeloid-derived suppressor cells (MDSCs) among TILs was analyzed by flow cytometry (h).Data are representative of three experiments. Error bars represent standard error of the mean. **p < .01, *p < .05.
Figure 4. Targeting Ags to B cells promotes PD1 and PDL1 expression in the tumor microenvironment
(a, b) BALB/c mice (n = 3) were immunized with scFv, D4, or scFv–D4 three times at 1-week intervals. Splenocytes from immunized mice were stimulated with scFv–D4 (20 μg/mL) for 3 d. PD1 expression on the surface of CD4+ (a) and CD8+ T cells (b) is shown.(c,d) BALB/c mice (n = 5) with established 4T1/E2 tumors were treated with scFv-D4 as described in ). Tumors were isolated on day 26, and tumor-infiltrating lymphocytes (TILs) from the tumors were harvested. PD1 expression on the surface of CD4+ (c) and CD8+ T cells (d) is shown.(e, f) BALB/c mice (n = 5) with established 4T1/E2 tumors were treated with PBS, scFv, D4, or scFv-D4. Tumors were isolated on day 26, and PD-L1 expression on the surface of tumor cells (CD45− cells) and CD45+ cells were assessed by flow cytometry.(g, h) 4T1/E2 cells and CT26/E2 cells were stimulated with mouse IFN-γ (20 ng/mL), and then surface PD-L1 expression was assessed.Data are representative of three experiments. Error bars represent standard error of the mean. ***p < .0001, **p < .01,*p < .05.
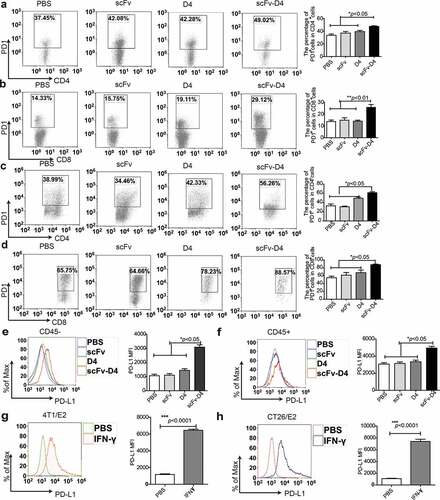
Figure 5. Combined treatment with scFv-D4 and anti-PD-1 induces immune cell infiltration and shows remarkable anti-tumor activity in a 4T1/E2 breast cancer model
(a) Schematic representation of subcutaneous (s.c.) 4T1/E2 breast cancer cell treatments applied to BALB/c mice.(b, c) BALB/c mice (n = 7) were challenged s.c. with 106 4T1/E2 tumor cells. The mice were treated, as described in ), when the tumor size (diameter) reached 3–5 mm. Tumor growth (b) and survival (c) were recorded.(d–i) BALB/c mice (n = 5 with established 4T1/E2 tumors were treated as described in Figure 5(a). Tumors were isolated on day 34, and the immune cells were analyzed by flow cytometry. Shown are the numbers of tumor-infiltrating (d) CD45+CD3+CD8+ T cells and (e) CD45+CD11b+Gr1+ cells in the different treatment groups. The frequencies of CD44+CD127+ (f), LAG3+CD160+ (g), and PD1+ (h) cells among CD8+T-cell subsets, as well as PD1+ (i) cells among CD4+T-cell subsets, are shown.Data are representative of three experiments. Error bars represent standard error of the mean. *p < .05
Figure 6. scFv-D4 and anti-PD1 combination therapy enhances T cell responses in a 4T1/E2 tumor model
BALB/c mice (n = 5) with established 4T1/E2 tumors were treated as described in Figure 5(a). Tumors were isolated on day 34, and the immune cells were analyzed by flow cytometry. Tumor-infiltrating lymphocytes (TILs) from the tumors were stimulated with PMA and ionomycin in the presence of brefeldin A for 4 h. The percentages of IFN-γ-producing CD4+ (a), Foxp3+ CD4+ (b), gzmb-producing CD4+ (c), IFN-γ-producing CD8+ (d), gzmB-producing CD8+ (e), and TNF-α-producing CD8+ T cells (f) among TILs are shown.Data are representative of three experiments. Error bars represent standard error of the mean. *p < .05
Figure 7. Treatment with fusion protein scFv–D4 and anti-PD1 induces significant anti-tumor effects in a CT26/E2 tumor model
(a) Schematic representation of subcutaneous (s.c.) CT26/E2 colon cancer cell treatments applied to BALB/c mice.(b) BALB/c mice (n = 7) were challenged s.c. with 106 CT26/E2 tumor cells. The mice were treated, as described in Figure 5(a), when the tumor size (diameter) reached 3–5 mm. Tumor growth (b) was recorded(c–f) BALB/c mice (n = 5) with established CT26/E2 tumors were treated as described in Figure 6(a). Tumors were isolated on day 34, and the immune cells were analyzed by flow cytometry. (c–e) Tumor-infiltrating lymphocytes (TILs) from the tumors were stimulated with PMA and ionomycin in the presence of brefeldin A for 4 h. Intracellular production of IFN-γ by CD4+, CD8+, and gzmB+ CD8+ T cells is shown. The numbers of tumor-infiltrating myeloid-derived suppressor cells (MDSCs) are shown (f).Data are representative of three experiments. Error bars represent standard error of the mean. Data are representative of three experiments. *p < .05.
Supplemental material