Figures & data
Figure 1. Updated survival analysis of patients with newly diagnosed GBM receiving HSPPC-96 vaccination. (a and b) Kaplan-Meier estimates of (a) progression-free survival and (b) overall survival in patients receiving HSPPC-96 vaccination in treating newly diagnosed GBM. (c and d) Based on the tumor-specific immune response (TSIR) after vaccination, patients were divided into a high TSIR after vaccination (post-vac) group (TSIR post-vac ≥ median) and a low TSIR after vaccination group (TSIR post-vac <median). Kaplan-Meier estimates of (c) progression-free survival and (d) overall survival in vaccinated GBM patients, stratified as high and low TSIR post-vac groups. Log-rank test was applied to estimate the difference. Vertical lines indicate censored time points. Dotted lines denote the 95% confidence interval
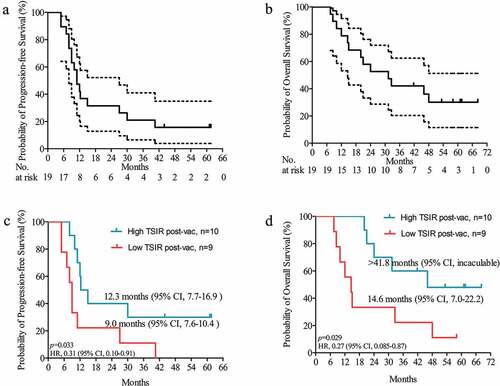
Table 1. Characteristics of 16 patients with TCR-seq information
Figure 2. Long-term survivors exhibit lower TCR repertoire diversity with enhanced inter-patient similarity. TCR repertoire diversity was evaluated by Shannon entropy index of CDR3 in TCR-β. (a) Pearson correlation of CDR3 diversity with overall survival in 16 vaccinated patients with available tumor tissue for TCR-β sequencing; (b) Comparison of CDR3 diversity between long-term survivors (LTS, ≥3-y overall survival) and short-term survivors (STS, <3-y overall survival), Wilcoxon nonparametric test; (c) Receiver Operating Characteristic (ROC) curve analysis for evaluating the ability of CDR3 diversity to distinguish between LTS and STS; (d) Comparison of inter-patient similarity (evaluated by Jaccard index) in different top percent portions of TCR clonotype abundance between LTS and STS. Wilcoxon nonparametric test. *P < .05; **P < .01; ***P < .001, ****P < .0001
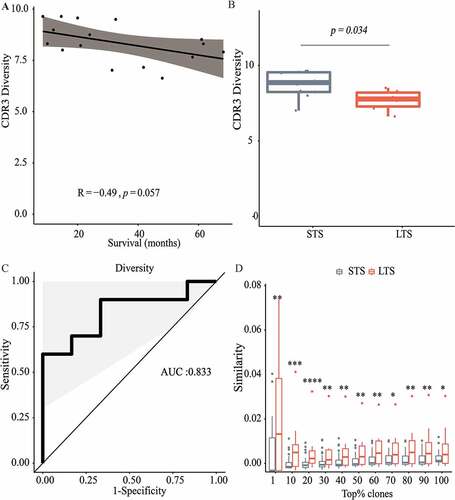
Figure 3. TCR clonotypes specific for long-term survivors. (a-d) CDR3-1 through CDR3-4 represents a higher abundance in LTS compared with STS. (e) Heat map showing the distribution of TSIR-related variables, common genetic features of gliomas, and CDR3 presence between LTS and STS. Variables with significantly higher prevalence in LTS than STS are in red. TSIR-related variables: TSIR_Abs. Increase, absolute TSIR increase from pre-to post-vaccination; TSIR_Ratio, ratio of post- to pre-vaccination TSIR; TSIR_pre-Vac, pre-vaccination TSIR; TSIR_post-Vac, post-vaccination TSIR. Red cells represent “≥ median level” and white cells indicate “< median level.” Genetic features: MGMT, O6-methylguanine-DNA methyltransferase promoter methylation; IDH, Isocitrate dehydrogenase mutations; TERT, Telomerase Reverse Transcriptase promoter mutations. Red cells represent “mutated” or “methylated” and white cells indicate “wild-type” or “un-methylated.” CDR3 s: red cells represent “presence” and white cells indicate “absence.” Categorical data were compared using Fisher’s exact test. Continuous data were compared using Wilcoxon nonparametric test
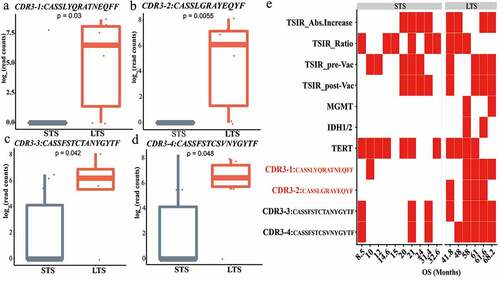
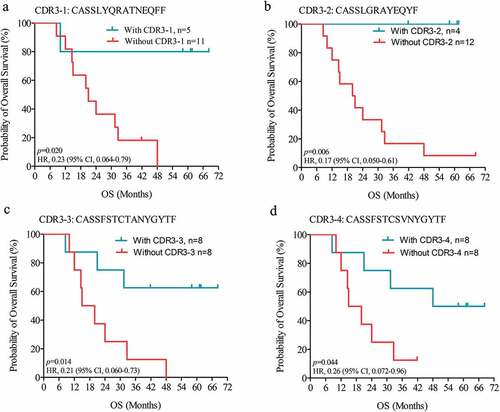
Figure 4. LTS-specific TCR clones predict durable survival. Kaplan-Meier estimates of overall survival in HSPPC-96 vaccinated GBM patients, grouped by the presence or absence of CDR3-1 (a), CDR3-2 (b), CDR3-3 (c), and CDR3-4 (d). Log-rank tests were applied to estimate differences. Vertical lines indicate censored time points