Figures & data
Figure 1. Experimental design. (a), BALB/c mice (n = 9) were vaccinated with 20 µg gp70 RNA-LPX on d 0 and 7. Dexa (4 mg/kg) was injected i.p. 3 h before or after vaccination (arrows). Control mice were vaccinated with RNA-LPX, but not Dexa treated. Blood was taken 6 h after both vaccinations to analyze cytokine release and on d 5, 12, 21, 28 and 35 for immune cell analysis by flow cytometry. Five mice were sacrificed on d 12 for analysis of antigen-specific cytokine release in splenocytes. (b), C57BL/6 mice (n = 5) were vaccinated with 15 µg Adpgk + 15 µg Reps1 RNA-LPX on d 0 and 7 with and without Dexa (4 mg/kg) treatment and underwent a similar analytic regimen as described in (a). On d 35, all mice were sacrificed for analysis of splenocytes for antigen-specific IFNγ release and cytotoxicity.
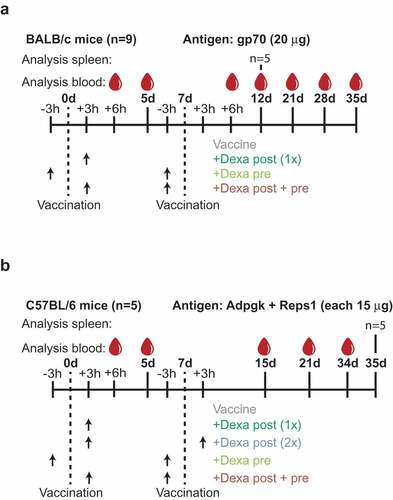
Figure 2. Dexamethasone suppresses RNA-LPX vaccine induced release of immune-response promoting cytokines. (a), Serum cytokine levels were analyzed in the serum of BALB/c mice (upper panel, n = 7 for control, n = 6 for groups treated as described in )) and of C57BL/6 mice (lower panel, n = 5, treated as described in )) 6 h post first vaccination. Mean (line) and individual values (symbols) are shown. The dotted line represents the mean of the control group. (b), Comparison of mean serum cytokine levels 6 h after the first and the second gp70 vaccination in BALB/c (n = 7 for control, n = 6 for treated groups, treated as described in )).
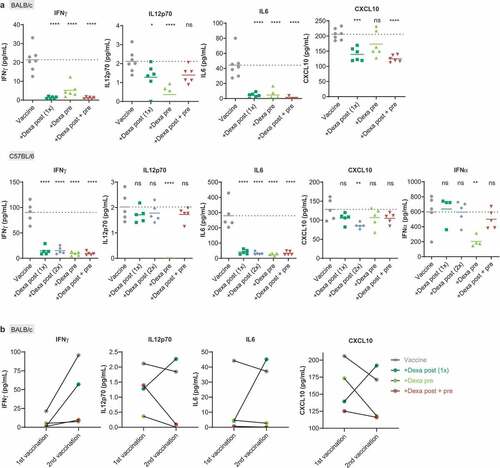
Figure 3. RNA-LPX-vaccinated mice premedicated with Dexa exhibit low CD4+ and CD8+ blood T-cell numbers and elevated Treg fractions. (a), CD4+, CD8+ or CD45+ cells per µL peripheral blood 5 d after the first treatment of BALB/c mice (n = 9, upper panel) with gp70 RNA-LPX or C57BL/6 mice (n = 5, lower panel) with Reps1 + Adpgk RNA-LPX and Dexa co-medication (see )) as quantified by flow cytometry. (b), CD4+ CD25+ FoxP3+ Tregs per µL peripheral blood 5 d after the first vaccination (left) and fraction of Tregs within the CD4+ T cell population after two vaccinations (right) of BALB/c mice (upper panel, n = 9, left; n = 5, right) treated with gp70 RNA-LPX, or C57BL/6 mice (lower panel, n = 5) treated with Reps1 + Adpgk RNA-LPX and Dexa co-medication. Mean (line) and individual values (symbols) are shown. The dotted line represents the mean of the control group.
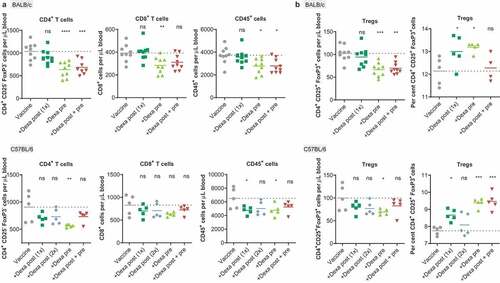
Figure 4. Priming, expansion, and cytotoxicity of antigen-specific T cells induced by RNA-LPX vaccination are severely suppressed by Dexa. (a), The number of nonspecific tetramer-negative or antigen-specific tetramer-positive CD8+ T cells per µL blood of the Dexa-treated groups was divided by the median number of nonspecific tetramer-negative or antigen-specific tetramer-positive T cells per µL blood, respectively, of the vaccine-only group as measured 5 d after the first vaccination. Depicted is the fold change of nonspecific CD8+ T cells or gp70- (left, n = 9), Adpgk- (middle, n = 5) and Reps1- (right, n = 5) specific CD8+ T cells as compared to the control group. Mean+SEM is depicted. (b), Fraction of antigen-specific CD8+ T cells in peripheral blood of RNA-LPX and Dexa-treated mice (gp70-specific (left): n = 9 on d 0 to 11, n = 5 on d 12, n = 4 on d 13 to 35; Adpgk- (middle) and Reps1-specific (right): n = 5). MeanSEM is depicted. Vertical dotted lines represent days of treatment. (c), Splenocytes of BALB/c mice (n = 5) were ex vivo restimulated with gp70 AH1-A5 peptide 12 d after treatment start. IFNγ positive (left) and IFNγ granzyme B (gzmB) double-positive (right) CD8+ T cells were determined by intracellular cytokine staining. Mean (line) and individual values (symbols) are shown. Values from unstimulated samples were subtracted (see also Supplementary Figure 2). (d), Percent lysis of MC38 cells 6 h post-co-culture with isolated CD8+ T cells as measured by xCELLigence RTCA MP. Mean+SEM is depicted (n = 3). (e) IFNγ secretion upon ex vivo restimulation of splenocytes with MC38 tumor cells (n = 5) determined by ELISpot. Mean (line) and individual values (symbols) are shown. The dotted line represents the mean of the control group. n.d., not detectable.
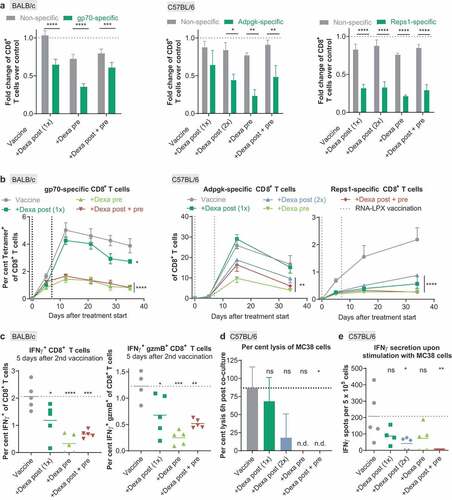
Figure 5. Therapeutic activity of RNA-LPX vaccination is significantly weakened by Dexa co-medication. (a–d), For a hematogenous lung dissemination tumor model, BALB/c mice (n = 20) were injected i.v. with CT26 tumor cells and treated as shown in (a). (b), Tumor nodules per lung of individual mice (left) and representative lung images (right). 500 nodules per lung was the upper limit of detection (ULOD). (c), Fraction of gp70-specific T cells in CD8+ T cells in the blood of mice (n = 10) 15 d after injection of tumor cells. (d), Correlation between tumor nodules per lung and the fraction of gp70-specific (Tetramer+) T cells in the blood. Tumor nodule values of 0 are not depicted but included in the spearman r and corresponding p value. (e-g), C57BL/6 mice (n = 10) were inoculated s.c. with MC38 tumor cells and treated as indicated in (e). (f), Mean tumor growth per group (left) and in individual mice (right). (g), Neoantigen (Adpgk, M86, and M143)-specific CD8+ T cells in the blood (n = 10). Mean (line) and individual values (symbols) are shown.
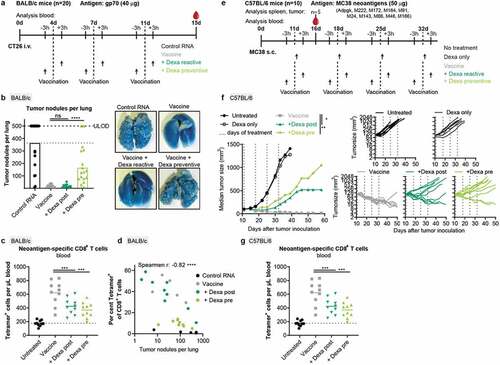
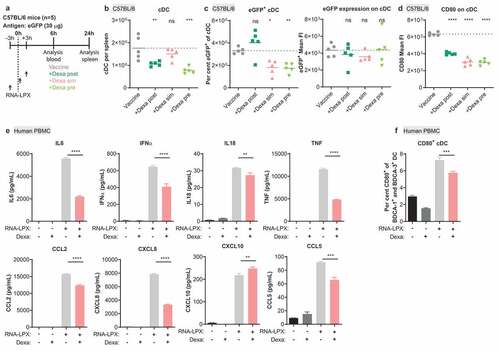
Figure 6. Dexa impairs the stimulatory potential of cDC in mice and of human PBMC. (a), Treatment schedule of C57BL/6 mice. (b), Splenic cDC (MHC class II+, CD11c+, non-T or B cells) as quantified by flow cytometry. (c), Fraction of eGFP+ cells (left) and expression levels of eGFP (right) within cDC. (d), CD80 expression on cDC. FI, fluorescence intensity. (b–d), Mean (line) and individual values (symbols) are shown. The dotted line represents the mean of the control group. (e–f), Human PBMC were stimulated for 17 h with 10 µg/mL RNA-LPX and/or 0.1 µM Dexa as shown. Depicted is the mean of three donors. (e), Cytokine and chemokine secretion. (f), Fraction of CD80+ cells among CD123− BDCA-1+ HLA-DR+ BDCA-3+ cDC. The dotted line represents the mean of the control group.