Figures & data
Figure 1. BEN-TBI conditioning improves survival and decreases morbidity from GvHD. BALB/c recipient mice received 40 mg/kg BEN iv or 200 mg/kg CY ip on day −2, 400 cGy TBI on day −1, and 107 BM with 3 × 10⁶ SC from naïve C57BL/6 mice on day 0. (a) Survival is shown. Pooled data from 3 experiments are shown, n = 15 mice/group, p < .0001. (b) Average weekly GvHD score with SEM is shown. Representative data from 3 experiments is shown, n = 5 mice/group. (c) Average % weight change from starting weight with SEM is shown. Representative data from 3 experiments is shown, n = 5 mice/group. * p < .05, ** p < .01, *** p < .001, **** p < .0001.
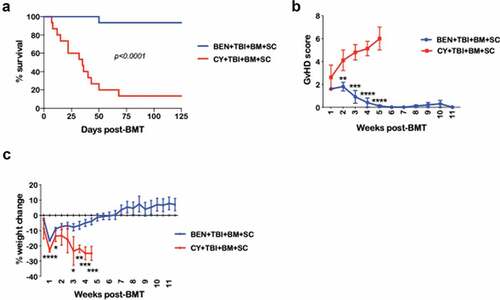
Figure 2. BEN-TBI conditioning improves GvHD independently of donor Tregs. (a) BALB/c recipient mice received 40 mg/kg BEN iv or 200 mg/kg CY ip on day −2, 400 cGy TBI on day −1, and 107 BM with 3 × 10⁶ SC from naïve C57BL/6 mice on day 0. Peripheral blood was collected on days +7, +14, +21, +35, and +70 and stained for CD4, CD25, and FoxP3 for flow cytometric analysis. CD4+ CD25+ FoxP3+ cells were considered Tregs. Representative flow cytometry histograms from day +35 are shown. CBCs were determined and used to calculate absolute cell numbers. Average absolute numbers of cells per μL of blood are shown with SEM. Pooled data from 4 experiments are shown, n = 19 mice/group. (b) BALB/c recipient mice received 40 mg/kg BEN iv or 200 mg/kg CY ip on day −2, 400 cGy TBI on day −1, and 107 BM with 3 × 10⁶ SC from naïve C57BL/6 mice on day 0. Splenic Tregs were isolated on day 0 (prior to transplant), +7, and +14. Tregs were plated with anti-CD3/CD28 bead activated, CellTrace Violet-stained T-cells from naïve C57BL/6 mice in a suppression assay. T-cells were plated at 100,000 cells per well in a 96-well U-bottom plate. Tregs were plated at a ratio of 1 Treg to 2 T-cells. Proliferation was assessed by flow after 3 days of co-culture. Average % proliferation with SEM is shown, compared to a control with no Tregs. Pooled data from 2 experiments are shown, n = 4–7 mice/group. (c) BALB/c recipient mice received 40 mg/kg BEN iv or 200 mg/kg CY ip on day −2, 400 cGy TBI on day −1, and 107 TCD-BM with 3 × 10⁶ tT with or without CD25+ cell depletion from naïve C57BL/6 mice on day 0. Survival is shown. CY+TBI+TCD-BM+tT vs. CY+TBI+TCD-BM+CD25- tT p = .0857, BEN+TBI+TCD-BM+CD25- tT vs. CY+TBI+TCD-BM+CD25- tT p = .0005. (d) CD4+ CD62L+ T-cells were isolated from naïve BALB/c mouse spleens and cultured with 5 ng/mL TGF-β and a 1:1 ratio of anti-CD3/CD28 beads for 3 days in the presence of various concentrations of BEN. Cells were phenotyped and the % CD4+ CD25+ FoxP3+ of all cells remaining at the end of the culture was assessed, as well as viability. BEN was washed out and cells were plated in a suppression assay at a ratio of 1 Treg to 1 T-cell (CD3/CD28 activated, CellTrace Violet-stained, from naïve C57BL/6 mice). After 3 days of co-culture, proliferation was assessed by flow cytometry. Representative flow cytometry plots are shown, with proliferation index (PI) indicated, with higher proliferation indices representing greater proliferation. The T-cells + beads plot represents activated T-cells without Tregs (a positive control for proliferation). Averages are shown with SEM. Pooled data from 3 experiments is shown, n = 3/condition.
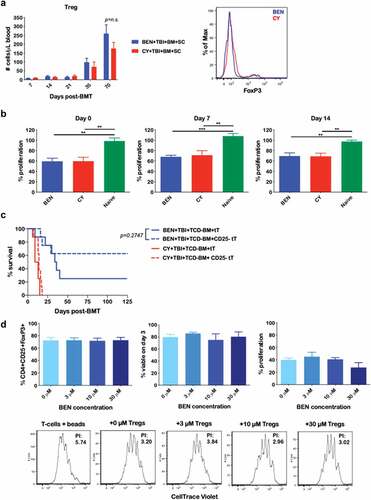
Figure 3. BEN-TBI does not result in appreciable donor T-cell phenotypic differences post-transplant when compared to CY-TBI. (a–c) BALB/c recipient mice received 40 mg/kg BEN iv or 200 mg/kg CY ip on day −2, 400 cGy TBI on day −1, and 107 TCD-BM from naïve C57BL/6 mice with 3 × 10⁶ CellTrace Violet-stained tT from naïve BoyJ mice on day 0. Blood and spleen were collected on day +3. (a) % donor T-cells (CD45.1+) was determined by flow cytometry. Using CBCs determined by HemaVet analysis, absolute number of donor T-cells was calculated. (b) After gating on CD45.1+ cells (representing donor T-cells), CellTrace Violet dilution was analyzed using ModFit software to determine proliferation index. Representative CellTrace Violet dilution is shown. (c) Within the CD45.1+ gate, cells were stratified by CellTracehigh (non- proliferative) and CellTracelow (proliferative) and CD25 and CD47 expression were analyzed by flow cytometry. Pooled data from 2 experiments with line at mean are shown, n = 6–7 mice/group. * p < .05, ** p < .01. (d-g) BALB/c recipient mice received 40 mg/kg BEN iv or 200 mg/kg CY ip on day −2, 400 cGy TBI on day −1, and 107 BM with 3 × 10⁶ SC from naïve C57BL/6 mice on day 0. Peripheral blood was collected on days +7, +14, +21, +35, and +70 and stained for CD8, CD4, Tbet, GATA3, RORγt, CD134, CD278, PD-1, TIM3, CTLA-4, and CD272. CBCs were determined and used to calculate absolute cell numbers. Average absolute numbers of cells per μL of blood are shown with SEM. Representative flow plots from day +7 with fluorescence minus one (FMO) controls are shown (e). (d) Pooled data from 4 experiments are shown, n = 19 mice/group. (e-g) Pooled data from 2 experiments are shown, n = 10 mice/group. ** p < .01.
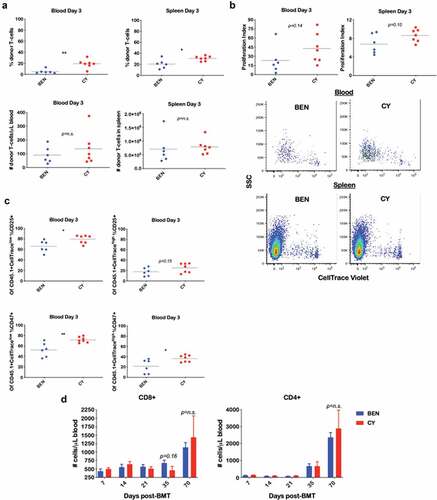
Figure 3. (Continued).
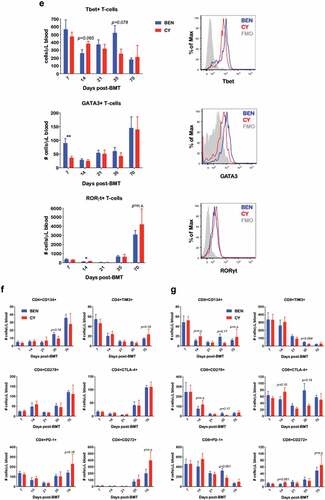
Figure 4. BEN-TBI results in T-cell tolerance to host, but not third party, MHC antigens in vitro. BALB/c recipient mice received 40 mg/kg BEN iv on day −2, 400 cGy TBI on day −1, and 107 BM with 3 × 10⁶ SC from naïve C57BL/6 mice on day 0. ≥+100 days post-BMT, splenic T-cells of surviving mice were isolated and plated in an MLR with irradiated (1500 cGy) SC from naïve C57BL/6, BALB/c, and FVB/N mice. On day 3 of co-culture, 0.5 μCi tritiated-thymidine was added to each well and on day 4, cells were harvested and counts per minute (CPM), denoting proliferation, were measured using a gamma counter. T-cells from naïve C57BL/6 mice were also plated with C57BL/6, BALB/c, and FVB/N SC as a control (a). Additionally, BEN T-cells were stimulated with anti-CD3/CD28 beads and CPM were determined (b). Average CPM with SEM is shown. Pooled data from 3 experiments are shown, n = 6–12 mice/condition. **** p < .0001.
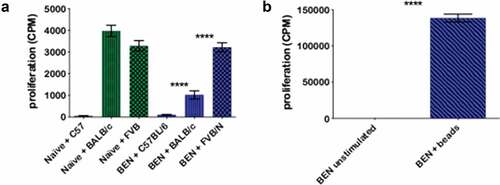
Figure 5. BEN-TBI results in T-cell tolerance to host MHC antigens in vivo. BALB/c recipient mice received 40 mg/kg BEN iv on day −2, 400 cGy TBI on day −1, and 107 BM with 3 × 10⁶ SC from naïve BoyJ mice on day 0. ≥+100 days post-BMT, splenic T-cells of surviving mice were isolated and given as donor T-cells in a secondary transplant. Secondary recipients received 850 cGy TBI on day −1 and 107 TCD-BM from naïve C57BL/6 mice on day 0 with or without T-cells from surviving BEN-TBI conditioned mice (called MHC-mismatched). As a control, secondary recipients received T-cells from C57BL/6 mice that had previously received BEN-TBI conditioning and a syngeneic BMT (called syngeneic). (a) Survival is shown. MHC-mismatched vs. syngeneic p < .0001. Pooled data from 3 experiments are shown, n = 12 mice/group. Average GvHD score and % weight change from starting weight are shown with SEM. Representative data from 3 experiments are shown, n = 5 mice/group. * p < .05, ** p < .01, *** p < .001. (b–e) On day 0, prior to infusion in the secondary transplant, isolated T-cells from MHC-mismatched and syngeneic primary transplants were phenotyped. Average % expression with SEM is shown. Pooled data from 3 experiments is shown, n = 3/condition. * p < .05. (f) Following the secondary transplant, peripheral blood was collected on days +7, +14, +21, +35, and +70 and stained for CD45.1, denoting T-cells from the primary transplant. CBCs were determined and used to calculate absolute number of donor T-cells per μL of blood. Average number of donor T-cells with SEM is shown. Pooled data from 2 experiments are shown, n = 8 mice/group.
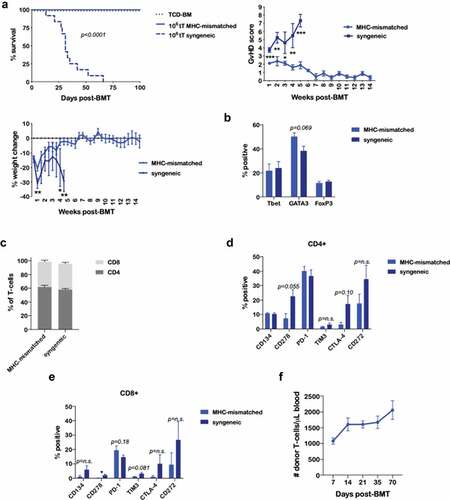
Figure 6. BEN-TBI preserves GvL. BALB/c recipient mice received 40 mg/kg BEN iv or 200 mg/kg CY ip on day −2, 400 cGy TBI on day −1, and 107 BM with 3 × 10⁶ SC from naïve C57BL/6 mice on day 0 with 0.1 × 10⁶ A20-luc tumor cells. (a) As a control, BEN-TBI conditioned mice received syngeneic BM and SC with A20-luc. Survival of BEN-TBI conditioned mice receiving an MHC-mismatched BMT and syngeneic BMT are shown, p < .0001. (b) Survival of BEN-TBI and CY-TBI conditioned mice receiving an MHC-mismatched BMT with A20-luc cells are shown, p < .0001. (c) Survival of BEN-TBI and CY-TBI conditioned mice receiving MHC-mismatched BMT with A20-luc are shown with deaths occurring without visible tumor censored. Only deaths with measurable tumor are included. BEN vs. CY p < .01. (d) Graft-versus-host disease free, relapse free survival (GRFS) is shown. A GvHD score ≥6 or visible tumor following day +8, as well as death, were considered incidents. % without incidence is shown. Pooled data from 4 experiments are shown, n = 10–20 mice/group. (e) Following BMT and A20-luc infusion, mice were imaged and luminescence was measured twice a week. Average ln(photons/sec/mouse) with SEM is shown. Representative data from 4 experiments is shown, n = 5 mice/group. * p < .05, ** p < .01. (f) Luminescent imaging representative of 4 experiments is shown, n = 5 mice/group.
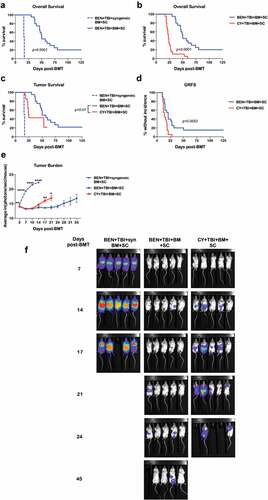
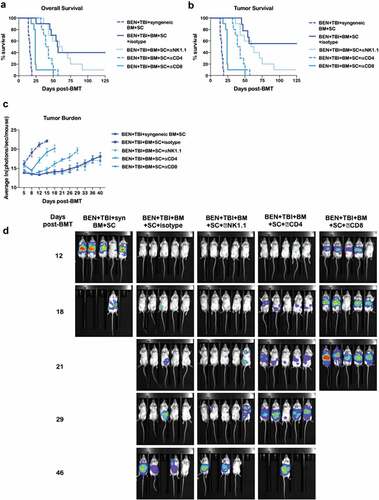
Figure 7. GvL with BEN-TBI is T-cell dependent. BALB/c recipient mice received 40 mg/kg BEN iv on day −2, 400 cGy TBI on day −1, and 107 BM with 3 × 10⁶ SC from naïve C57BL/6 mice on day 0 with 0.1 × 10⁶ A20-luc tumor cells. Mice received syngeneic BM and SC as a control. All mice received weekly ip antibody injections of 200 μg beginning on day +3 (isotype, NK1.1, CD4, or CD8). (a) Survival is shown. Pooled data from 2 experiments is shown, n = 10 mice/group. Syngeneic vs. all other conditions p < .0001; isotype vs. NK1.1 p = n.s., vs. CD4 p = .0068, vs. CD8 p < .0001. (b) Deaths without measurable tumor are censored and survival is shown. Syngeneic vs. all other conditions p < .0001; isotype vs. NK1.1 p = n.s., vs. CD4 p = .0011, vs. CD8 p < .0001. (c) Following BMT and A20-luc infusion, mice were imaged and luminescence was measured twice weekly. Average ln(photons/sec/mouse) with SEM is shown. Syngeneic vs. all other conditions p < .05 at all time points; isotype vs. NK1.1 p = n.s. at all time points, vs. CD4 p < .05 day +12, +21, +26, +29, vs. CD8 p < .05 at all time points. (d) Representative luminescent imaging of 2 experiments is shown, n = 5 mice/group.