Figures & data
Figure 1. Establishment of a novel mouse syngeneic model of HGSOC. 1 x 10Citation7 mCherry+ TKO ovarian cancer cells (detailed in Material and methods section) were injected i.p, in C57BL/6 mice. a. Live animal imaging of mCherry fluorescence showing i.p. tumor burden. Three representative animals are shown through time to demonstrate disease progression; b. Typical tumor kinetics observed in this model as quantified by measuring mCherry fluorescence ROI area as described in the Materials and methods Section. The three phases of disease progression described in the text are shown; ** p < .0001 comparing day 3 with days 11, 13, and 17; c. Abdominal area measurements from X-ray images as described in the Materials and methods Section showing the development of ascites; d. Necropsy image of a representative animal sacrificed on day 30 showing omental cake (yellow arrow) and hemorrhagic ascites (blue arrow).
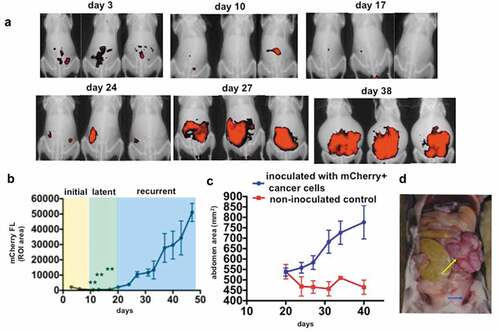
Figure 2. Transimmunization prevents recurrence. Mice bearing i.p. tumors were randomized into three groups 4 days after inoculation of cancer cells: group 1) PBS control (n = 20), group 2) TI TKO (n = 10), and group 3) TI YUMM (n = 10). Treatment was administered as described in the Materials and methods section. a. Tumor growth curves showing mCherry FL ROI area. Data are presented as mean ± SEM. Arrow indicates administration of treatment; **** p < .0001 PBS control vs TI TKO; ns, p = .1079 PBS control vs TI YUMM by Two-Way ANOVA. b. Live imaging of animals on day 27 showing mCherry fluorescence signal as a surrogate for i.p. tumor burden. Ten animals are shown per group; c. Graphical representation of tumor incidence by live animal imaging.
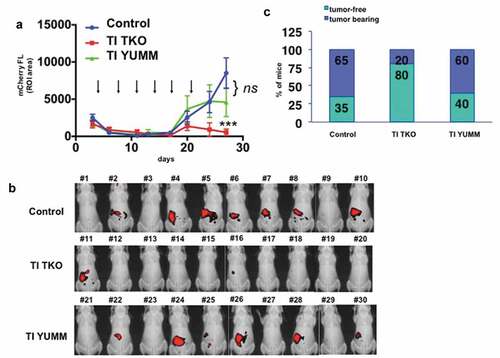
Figure 3. Transimmunization enhances intra-tumoral T cell influx.Tumors from animals in Figure 3 were collected on day 30 and immunostained for a. CD8; b. CD4; and c. FOXP3. Top panel. For each tumor sample, quantification was performed on three randomly selected tumor areas and shown as mean ± SEM. ** p < .01; ns, p = .0904; bottom panel shows representative images for each immunostain.
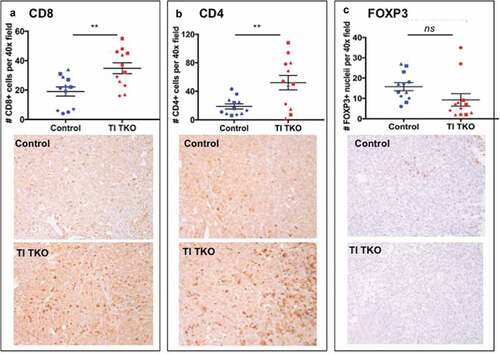
Figure 4. Transimmunization inhibits the formation of tumor/malignant ascites-associated macrophages (TAMs). Ascites or peritoneal lavage were collected at the end of the study and analyzed by flow cytometry for CD11b and F4/80. a. Left panel, representative dot plot images showing quadrant analysis; right panel, representative F4/80 MFI histogram plots for CD11b+ cells; b. Graphical representation of the percentage of CD11b+/F480+ cells in each group. Data are presented as mean ± SEM; * p = .042; ns, p > .05; c. Graphical representation of F4/80 MFI in CD11b+ cells in each group. Data are presented as mean ± SEM; * p = .037; ns, p > .05. Statistical analysis was performed using Ordinary One-way ANOVA with Tukey post hoc analysis.
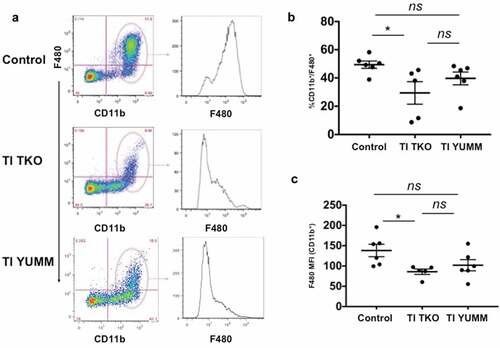
Figure 5. Transimmunization significantly decreases the intra-peritoneal levels of granulocytic myeloid-derived suppressor cells. Ascites or peritoneal lavage were collected at the end of the study and analyzed by flow cytometry for CD11b, Gr1, Ly6C, and Ly6 G. a. Representative dot plot images showing distinct cell populations (CD11b+/Gr1high and CD11b+/Gr1low). b. Representative dot plot images showing subanalysis of CD11b+/Gr1high and CD11b+/Gr1low populations for Ly6C and Ly6 G; c. Graphical representation of percentage of CD11b+/Gr1high cells in each group. Data are presented as mean ± SEM; * p = .0388; ns, p > .05 by Ordinary One-way ANOVA with Tukey post hoc analysis.
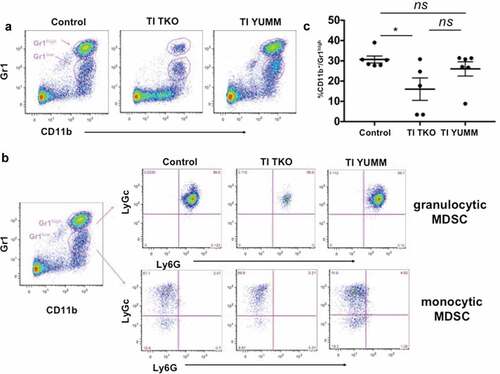
Figure 6. Transimmunization significantly improves memory T cell responses in the peritoneum. Ascites or peritoneal lavage were collected at the end of the study and analyzed by flow cytometry for CD4, CD8, CD44, and CD62 L. a. Dot plots showing gating strategy for analysis of different phenotypes of CD8 T cells; b. Representative dot plot images for each group showing sub-analysis for CD44 and CD62 L in CD8+ cells; c. Graphical representation of the percentage of CD8+/CD44+ memory T cells in each group. Data are presented as mean ± SEM; ** p < .01; ns, p > .05; d. Percentage of CD8 naive T cells in each group. Data are presented as mean ± SEM; * p = .0125; ns, p > .05. Statistical analysis is performed using Ordinary One-way ANOVA with Tukey post hoc analysis.
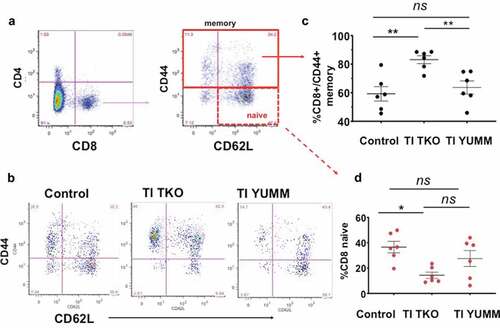
Figure 7. Transimmunization decreases differentiation/recruitment of granulocytic MDSC. Splenocytes were collected at the end of the study and analyzed by flow cytometry for CD11b, Gr1, Ly6C, and Ly6 G. a. Representative dot plot images showing distinct CD11b+/Gr1high and CD11b+/Gr1low cell populations and sub-analysis of these populations for Ly6C and Ly6 G; Graphical representation of the percentage of b. CD11b+/Gr1high cells and c. CD11b+/Gr1low cells in each treatment group with tumor-bearing and non-tumor-bearing animals shown; p < .05 for both graphs; ns, not significant by One-Way ANOVA.
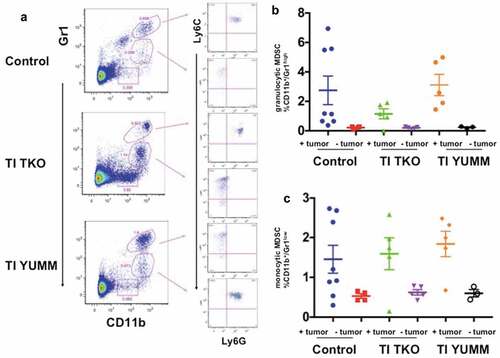
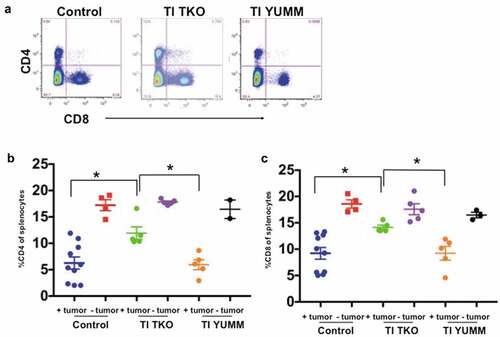
Figure 8. Transimmunization enhances systemic CD4 and CD8 T cell proliferation. Splenocytes were collected at the end of the study and analyzed by flow cytometry for CD4 and CD8. a. Representative dot plot images showing quadrant analysis for CD4 and CD8 in the different groups. b. Graphical representation of the percentage of CD4 cells. Data are presented as mean ± SEM; * p < .05. c. Graphical representation of the percentage of CD8 cells. Data are presented as mean ± SEM; * p < .05. Statistical analysis is performed using Ordinary One-way ANOVA with Tukey post hoc analysis.