Figures & data
Figure 1. Immune contexture is defined by the tissue of origin, independent of chemotherapy.
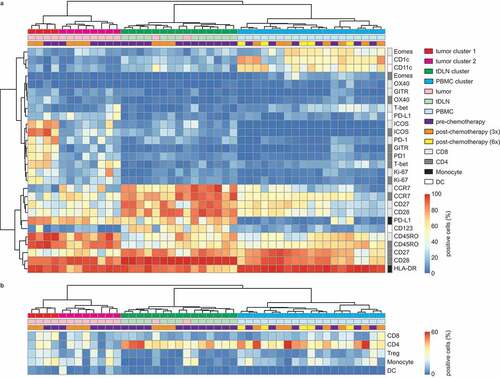
Figure 2. Immune cell distribution is comparable between pre- and post-chemotherapy tumors. (a) Epithelial infiltration of CD3+, CD8+, CD27+, PD1+, FoxP3+, and CD20+ cells in pre- and post-chemotherapy tumors. Density is defined as cells/mm2. (b) Stromal infiltration of CD3+, CD8+, CD27+, PD1+, FoxP3+, and CD20+ cells in pre- and post-chemotherapy tumors. Density is defined as cells/mm2. (c) Epithelial and stromal infiltration of CD16+ cells in pre- and post-chemotherapy tumors. Epithelial infiltration was determined by density in cells/mm2, stromal infiltration was determined by the percentage of positive area. (d) Epithelial infiltration of CD11 c+, LAMP3+, CD68+, and CD163+ cells in pre- and post-chemotherapy tumors. Density is defined as cells/mm2. (e) Stromal infiltration of CD11 c+, LAMP3+, CD68+, and CD163+ cells in pre- and post-chemotherapy tumors. Stromal infiltration is determined by the percentage of positive area. (f) Epithelial and stromal infiltration of PD-L1+ cells in pre- and post-chemotherapy tumors. Infiltration was determined by the percentage of positive area. (a–f) Representative samples are depicted in supplementary figure S5. Differences in the number of tumor-infiltrating immune cells on FFPE slides were determined by two-tailed Mann Whitney test. N-numbers are described in supplementary table S3 C. G, Median immune cell density of all epithelial and stromal immune cells depicted in a–f. Comparability between pre- and post-chemotherapy tumors was determined by a Pearson correlation test. R2 = 0.92, <0.0001.
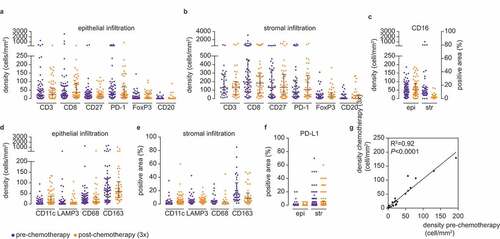
Figure 3. T-cell differentiation is heterogeneous across tissue types.
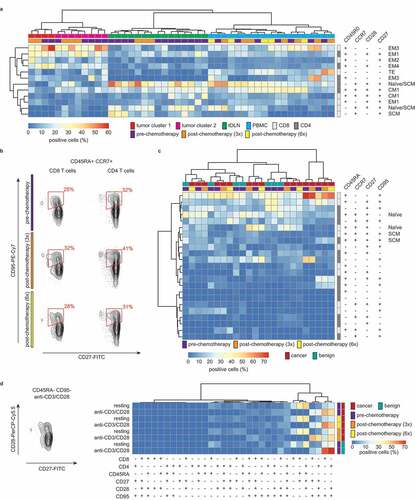
Figure 4. ICOS, GITR, and CTLA-4 co-expression.
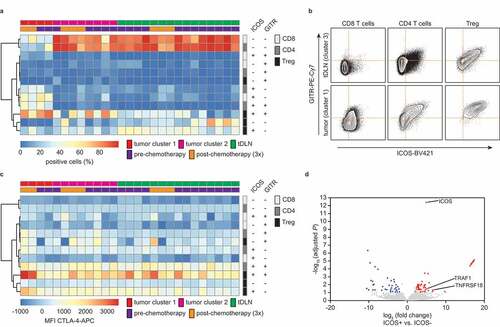
Figure 5. PD-1+ cells only have a survival benefit in pre-chemotherapy tumors who were completely removed after primary surgical debulking.
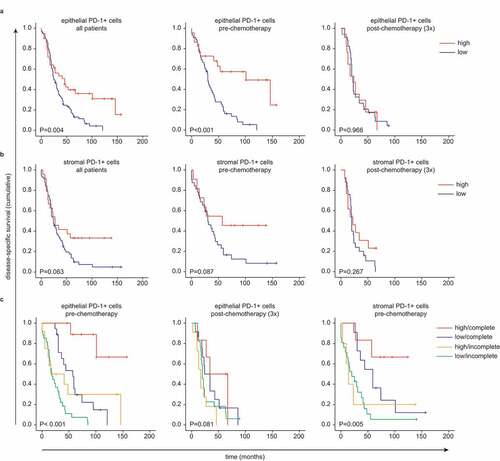
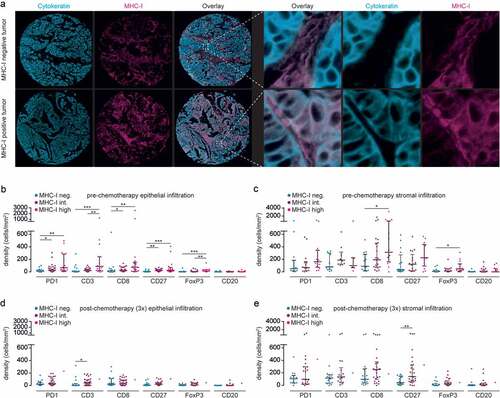
Figure 6. Treatment of HGSOC patients with neoadjuvant chemotherapy is associated with minimal expression of MHC-I.