Figures & data
Figure 1. Inverse correlation between the expression of PSME3 and antigen presentation in multiple cancer cell lines. (a) PSME3 mRNA levels were analyzed by RT-qPCR in different cell lines and normalized to β-actin mRNA levels. The MRC5 cell line was used as a reference. Experiments were performed in triplicate. Data are expressed as the mean ± SEM from three technical replicates. (b) Western blot analysis and quantification (relative to the housekeeping protein β-actin) of PSME3 expression. Protein levels are indicated below each gel. (c) PSME3 protein localization was determined by immunofluorescence in several tumor cell lines and in the MRC5 normal cell line. PSME3 was stained with Alexa Fluor 488, and nuclei were counterstained with DAPI. Cells were analyzed by confocal microscopy. As expected, the regulator PSME3 was localized in the nucleus in all tested cell lines. (d, e) All cell types were transfected in vitro with Glob-intron-SL8 (d, left panel) or Glob-intron-MBP(79–87) (d, right panel), β-Glob-exon-SL8 (e, left panel) and OVA cDNA (e, right panel) expression constructs. The cells were incubated with the SL8-specific CD8+T cell hybridoma (B3Z) for 16h. The data show the average of at least three independent experiments ± SD minus the values from mock-transfected cells. Free SL8 peptides were added to the cells to ensure that the T cell assays were performed under non-saturation conditions and that the expression of MHC-I molecules was not affected.
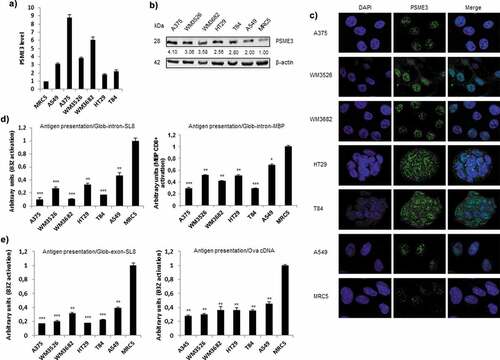
Figure 2. Exogenous PSME3 overexpression decreases antigen presentation. (a) MRC5 and A549 were transfected with a construct expressing PSME3 WT from 0.0625 to 0.5 µg or a corresponding empty construct for 48 h. PSME3 protein levels were examined by Western blotting using β-actin as a loading control. Protein levels are indicated below each gel. (b) MRC5 and A549 were transfected with a construct expressing Flag-PSME3 WT (0.25 µg). The Flag tag was stained with Alexa Fluor 488, and the nuclei were stained with DAPI. Cells were analyzed by confocal microscopy. As expected, exogenous transfected PSME3 WT localized in the nuclei. (c) MRC5 cells (left panel) and A549 cells (right panel). The cells were incubated with the SL8-specific CD8+T cell hybridoma (B3Z) for 16 h. The data show the average of at least three independent experiments ± SD minus the values from mock-transfected cells. All cells were transfected with increasing amounts (from 0 to 0.5 μg) of Glob-intron-SL8 construct with a final total concentration of 1 µg of plasmids in each cell lines. (d) MRC5 cells were transfected with a PSME3 WT construct for 48 h. The increase in PSME3 protein expression had no effect on the expression of REGα protein. (e) MRC5 cells were transfected with increasing amounts (from 0 to 0.5 μg) of Flag-PSME3 construct for 48 h. At 36 h post-transfection, the cells were then treated overnight with epoxomicin (300 nM). Next, the cells were incubated with the B3Z T cell hybridoma for 16 h. The data show the average of at least three independent experiments ± SD. *** p <.001, * p <.05 (unpaired t-test). (f) Western blot analysis and quantification (relative to the housekeeping protein β-actin) of p21 expression in MRC5 cells treated overnight with epoxomicin at 300 nM. Protein levels are indicated below each gel. As expected, p21 protein levels increased after 12 h of epoxomicin treatment, even though the treated cells overexpressed the exogenous regulator PSME3.
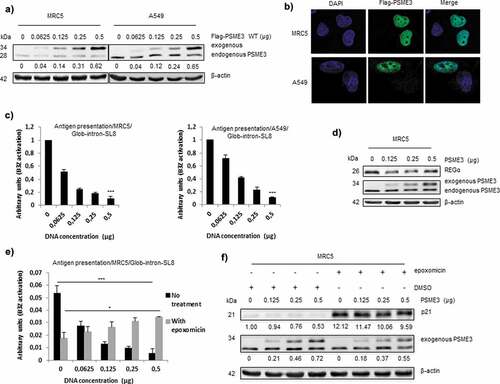
Figure 3. Knockdown and knockout of the expression of the regulator PSME3 promotes antigen presentation. The A375, WM3526, WM3682, HT29 and T84 cell lines were transfected with siRNA specific for PSME3 (50 and 100 nM) or siRNA negative control (0) for 48 h and then analyzed by RT-qPCR (a), Western blotting (b) and a T cell assay (c). (a) Experiments were performed in triplicate. Data are expressed as the mean ± SEM of three technical replicates. (b) Western blotting was performed to analyze and quantify PSME3 and p21 expression, and β-actin was used as a reference protein. The relative protein level is indicated below each gel. (c) Cell lines were transfected with the Glob-intron-SL8 construct (0.5 μg) and treated with different concentrations of siRNA specific for PSME3 (0, 50 and 100 nM). After 48 h, the different cell lines were incubated with the B3Z T cell hybridoma for 16 h. The data show the average of at least three independent experiments ± SD minus the values from mock-transfected cells. (d) qPCR analysis of A375 cells transfected with siRNA specific for PSME3 (50 and 100 nM) was performed. The inhibition of PSME3 mRNA levels was quantified and normalized to β-actin mRNA levels. Experiments were performed in triplicate. Data are expressed as the mean ± SEM from three technical replicates. (e) Western blot analysis and quantification (relative to the housekeeping protein β-actin) of PSME3 and p21 expression. Protein levels are indicated below each gel. (f) The A375cXI and A375 cell lines were both transfected with the Glob-intron-SL8 construct (0.5 μg) for 48 h, and PSME3-siRNA (50 or 100 nM) was only added to A375 cells. The cells were incubated with the B3Z T cell hybridoma for 16 h. The data show the average of at least three independent experiments ± SD minus the values from mock-transfected cells. *** p <.001, ** p <.01 (unpaired t-test). (g) The A375, A375cXI, WM3526 and WM3682 cell lines were co-transfected with the Glob-intron-SL8 (0.5 μg) and the H2-Kd (0.5 μg) constructs for 48 h. The different cell types were then incubated with the Busa14 T cell hybridoma for 16 h. The data show the average of at least three independent experiments ± SD minus the values from mock-transfected cells. ** p <.01 (unpaired t-test). Note that panel C refers to the experiment shown in panels A and B, while panel F refers to the experiment of panel E. Differences in the magnitude of B3Z activation correlate with the extent of PSME3 reduction obtained by siRNA in the different experiments.
Figure 4. PSME3 regulates the nuclear proteasomal pathway. (a) Western blotting was performed to analyze and quantify PSME3, REGα and p21 protein expression in A375cXI cells (relative to the housekeeping protein β-actin). The cells were transfected with a construct expressing PSME3 WT or the mutated PSME3 N151Y at different concentrations or with a corresponding empty construct for 48 h. Protein levels are indicated below each gel. (b) A375cXI cells transiently expressing the mouse H-2Kb molecules and the intron-derived SL8 epitope. The same cells were co-transfected with increasing amounts (from 0 to 0.5 μg) of constructs expressing Flag-PSME3 WT or the mutated Flag-PSME3-N151Y at different concentrations and then incubated with the B3Z T cell hybridoma for 16 h. Data are the average of at least three independent experiments ± SD minus the values from mock-transfected cells. (c) A375cXI cells were transfected with a construct expressing a Flag-PSME3 WT or a Flag-PSME3 N151Y or a Flag-PSME3-ΔNLS. The Flag tag was stained with Alexa Fluor 488, and the nuclei were stained with DAPI. Cells were analyzed by confocal microscopy. As expected, the exogenous PSME3 WT and PSME3-N151Y proteins were localized in the nuclei, when PSME3ΔNLS was localized in the nucleus and in the cytoplasm. (d) The interactions of the 20S proteasome with the exogenous Flag-PSME3 WT or a Flag-PSME3-N151Y or a Flag-PSME3-ΔNLS constructs were analyzed using DuoLink. PLA was performed using an antibody against the Flag tag and α4 subunit – of the 20S proteasome. Staining was analyzed by confocal microscopy. (e) Immunoprecipitation was performed using the PSME3 antibody, and Western blotting was carried out using an antibody against the 20S α6 subunit. For that purpose the A375cXI CRISPR cell line was transfected with the different Flag-PSME3 constructs and a comparison was made with the endogenous PSME3 in the A375 for the capacity of the Flag construct to bind to the 20S core compare to the endogenous PSME3. This experiment confirmed the interaction of the 20S proteasome and exogenous PSME3 WT or PSME3-N151Y. (f) Western blot analysis and quantification (relative to the housekeeping protein β-actin) of PSME3, REGα and p21 protein levels in A375c.XI cells transfected with a construct expressing PSME3-WT or PSME3-ΔNLS at different concentrations or with a corresponding empty construct for 48 h. Protein levels are indicated below each gel. (g) A375cXI cells transiently expressing the mouse H-2Kb molecules and intron-derived SL8 epitope. The same cells were co-transfected with increasing amounts (from 0 to 0.5 μg) of constructs expressing Flag-PSME3 WT or the mutated Flag- PSME3-ΔNLS at different concentrations and were incubated with the B3Z T cell hybridoma for 16 h. Data are the average of at least three independent experiments ± SD minus the values from mock-transfected cells.
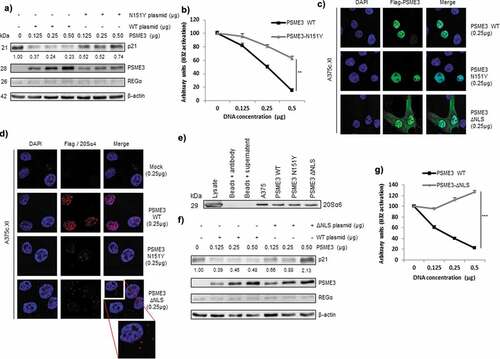
Figure 5. PSME3 promotes the degradation of MHC-I PTP-derived antigenic epitopes. (a) A375, WM3526, WM3682, HT29, T84, A549, MRC5 and A375cXI cell lines expressing the Glob-intron-SL8 construct (0.5 μg) were cultured with BMDCs for 24 h. The BMDCs were then co-cultured with the SL8-specific CD8+T cell hybridoma (B3Z) for 16 h, and T cell activation was estimated by measuring β-galactosidase levels. The data show the average of at least three independent experiments ± SD minus the values from mock-transfected cells. *** p <.001, ** p <.01, * p <.05 (unpaired t-test). Hydrolysis rates of KH-52 and KH-53 (b) and MP-45 and MP-46 (c) peptides. Precursor substrates were incubated with human 20S constitutive proteasomes (h20Sc) alone or activated by PSME3 or REGα/β, and the amino groups released were measured with fluorescamine at the indicated time points. Data are representative of three independent experiments. (d) Heatmap comparison of the abundance of significant peptides generated after 8 hours from proteasomal degradation of KH-52 precursor peptide in the h20Sc (biological and technical replicates of samples designated A and C, respectively) and PSME3-h20Sc (biological and technical replicates of samples designated B and D, respectively) samples. Samples were analyzed by nLC-MS/MS and processed by MaxQuant against the database KH-52 Intron SIINKEL + contaminant sequences. Differences and similarities in peptide intensities (normalized to the Z-score) are shown; green indicates decreased levels, and red indicates increased levels. Data were obtained from supervised hierarchical clustering analysis by applying a t-test, the Benjamini Hochberg correction and a p-value of 0.05. (e) Box plot of SIINFKEL peptide intensity calculated by MaxQuant in the h20Sc (in green) and PSME3-h20Sc (in blue) samples. (f) Cross presentation assay of peptide products generated during hydrolysis by 20S proteasome of KH-52 peptide precursor in the presence or absence of PSME3. *** p <.001 (unpaired t-test).
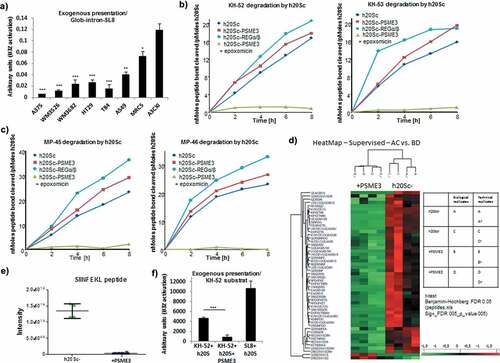
Figure 6. Knockout of PSME3 gene causes tumor growth defect. (a) The B6 fibroblast and MCA205 sarcoma cell lines were transfected with β-Glob-intron-SL8 constructs. Cells were co-cultured with the SL8-specific CD8+T cell hybridoma (B3Z) for 16 h. Upper panel shows the protein level of PSME3 in the tumor cells assessed by Western Blot (quantification relative to the housekeeping protein β-actin). Lower panel shows the relative level of antigen presentation in the tumor cells. (b) The MCA205 sarcoma cell line and the Cas9-PSME3 MCA205 clones MCAc13, MCAc19 and MCAc21 were transfected with the β-Glob-intron-SL8 construct for 48 h. The cells were then co-cultured with the SL8-specific CD8 + T cell hybridoma (B3Z) for 16 h. Upper panel shows the protein level of PSME3 in the tumor cells assessed by Western Blot (quantification relative to the housekeeping protein β-actin). Lower panel shows the relative level of antigen presentation in the tumor cells. (c) Tumor size in area of sarcoma MCA205 WT and Cas9-PSME3 MCA205 clones subcutaneously inoculated into the right flank of immunocompetent C57BL/6 mice. Data are given as mean ± SEM of 12 mice per group. (d) Tumor size in area of sarcoma MCA205 WT and Cas9-PSME3 MCA205 clones subcutaneously inoculated into the right flank of immunodeficient Nu/Nu mice or immunocompetent C57BL/6 mice (left panel). Relative growth of MCA205 WT and Cas9-PSME3 MCA205 clones in immunodeficient Nu/Nu mice compared to immunocompetent C57BL/6 mice. Data are given as mean ± SEM of 6 mice per group. *p <.05, **p <.01 (ANOVA with Tukey’s multiple comparaison test comparing all groups).