Figures & data
Table 1. Patient characteristics at baseline.
Figure 1. Induction of EGF-specific humoral immune response in NSCLC patients. (a) Vaccination and sampling schedules during CIMAvax-EGF immunotherapy. (b) Percent of vaccinated patients classified as poor antibody responders (PAR), good antibody responders (GAR) and super-good antibody responders (SGAR) during the induction phase of vaccination schedule. (c) EGF-specific antibody titers elicited in NSCLC patients from GAR (n = 85), PAR (n = 27) and control (n = 28) groups during 1 y of vaccination. Serum EGF IgG antibody titers were determined by ELISA at indicated time points and presented as the inverse of serum dilution. Significant differences were found among GAR, PAR and control curves according to Generalized Linear Model (P < .0001). D) IgG response to EGF-derived peptides from vaccinated patients classified as GAR (n = 40). Antibody levels against different regions of EGF molecule were determined by ELISA at indicated time points and presented as values of absorbance at 405 nm. Asterisks (*) represent significant differences according to Dunn’s test: **P < .01, ***P < .001. E) Levels of EGF-specific IgG subclasses from 40 vaccinated patients. Serum levels of EGF-specific IgG1, IgG2, IgG3 and IgG4 levels were determined by ELISA using subclass-specific antibodies and presented as values of absorbance at 405 nm. Asterisks (*) represent significant differences according to Dunn’s test: *P < .05, ***P < .001.
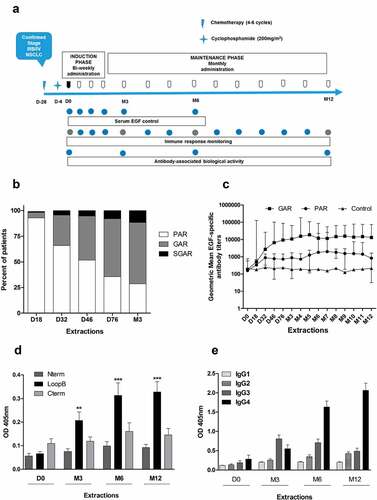
Figure 2. In vitro biological activity of EGF-specific antibodies elicited in vaccinated NSCLC patients. (a) Inhibition percent of EGFR activation in H292 lung cancer cells by sera from immunized NSCLC patients (n = 24). Starved H292 cells were incubated with NSCLC patient immune sera (1:100) and activated with rhEGF. The levels of phosphorylated (pEGFR) and EGFR from H292 lysates were determined by Western blot using specific antibodies. Pre-immune serum was used to set 100% EGFR activation signaling in each evaluated patient. Asterisks (*) represent significant differences according to Wilcoxon signed-rank test: **P < .01, ***P < .001. (b) Relationship between the anti-EGF Ab titers and inhibition of EGFR activation. Asterisks (*) indicate a significant correlation according to Spearman’s correlation coefficient: *P < .05, ***P < .001. (c) Immunoblots showing the EGFR phosphorylation levels obtained using the sera of one representative patient.
Figure 3. Affinity maturation of EGF-specific immune response elicited in NSCLC vaccinated with CIMAvax-EGF. (a) Concentration of EGF-specific antibodies in immunized patient’s sera (n = 20). Asterisks represent significant differences according to Wilcoxon signed-rank test: **P < .01, ***P < .001. (b) Kinetic constants for the first binding (koff1 and kon1) of EGF-specific antibodies elicited in vaccinated patients. Asterisks represent significant differences according to the Wilcoxon signed-rank test: **P < .01. Only significant differences are represented. Concentration and kinetic constants of elicited EGF-specific antibodies were determined by SPR technology. (c) Correlation between in vitro biological activity of anti-EGF antibodies and their affinities. Asterisks (*) indicate a significant correlation P < .05 according to Spearman’s correlation coefficient.
Figure 4. Immune response and survival outcome of NSCLC patients immunized with CIMAvax-EGF. (a) Overall survival of vaccinated patients according to EGF-specific antibody titers 3 months after first immunization. (b) Clinical impact of in vitro biological activity. Differences in survival times were assessed by the log-rank test.
Figure 5. Serum levels of EGF and different NSCLC-associated proteins in patients vaccinated with CIMAvax-EGF. Circulating EGF levels in immunized (a), n = 40) and control (b), n = 15) patients during 6 months. (c) Serum levels of TGFα at baseline and after 6 months of treatment with CIMAvax-EGF (n = 40). Serum levels were determined by a commercial ELISA kit at indicated time points. Asterisks (*) represent significant differences according to Wilcoxon signed-rank test: **P < .01, ***P < .001.