
Figures & data
Figure 1. A CD4 neoantigen vaccine improves LRT-mediated survival of mice with CT26 tumors in a CD8+ T cell-dependent manner. (a–c) CT26 tumor growth (a) and survival (b) of BALB/c mice (n = 7–8/group) locally irradiated with 12 Gy or 3 × 6 Gy at a mean volume of 60 mm3. (c) gp70-AH1 tetramer+ CD8+ T cells in blood of treated mice (n = 4–5/group). (d-f) CT26 tumor growth (d) and survival (e) of mice (n = 7–12/group) locally irradiated with 12 Gy at a mean tumor volume of ~70 mm3 and immunized three times with CT26 PME1 or control RNA-LPX. (f) Gp70-AH1 tetramer+ CD8+ T cells in blood of treated mice (n = all mice/group). (g-i) CT26 tumor growth (g) and survival (h) of mice (n = 8–9/group) immunized with CT26 PME1 or control RNA and locally irradiated at a mean tumor volume of 90 mm3. CD8+ T cells were depleted 6 days after LRT, administering the anti-CD8 antibody every 3–4 days over 3 weeks. (i) Gp70-AH1 tetramer+ CD8+ T cells in blood of treated mice (n = 8–9/group). Significance was determined using (b, e, h) Mantel-cox log-rank test and (c, f, i) one-way ANOVA, Tukey’s multiple comparison test. (a, d, g) Tumor growth is displayed on a log2-scale. Ratios depict frequency of mice with complete tumor responses (CR). Mean±SEM. nd = not determined.
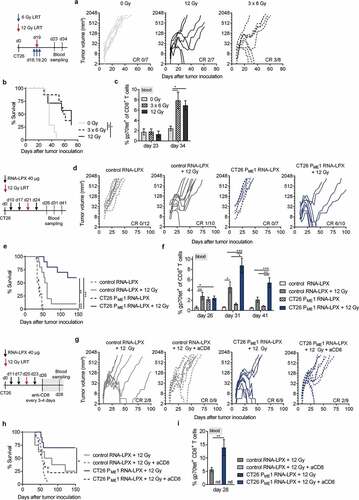
Figure 2. Activated poly-functional Th1-like CD4+ T cells against the immunodominant vaccine-encoded CD4 neoantigen are induced in the spleen of CD4 neoantigen vaccine/LRT treated mice. (a–c) CT26 tumor growth (a) and survival (b) of BALB/c mice (n = 7–10/group) treated with 12 Gy at a mean tumor volume of 45 mm3 and immunized with different RNA-LPX vaccines. RNA-LPX vaccines included CT26 PME1; CT26 ME1, the most immunogenic CT26 PME1 neoantigen; Pctrl. encoding mutations not expressed in CT26 and control RNA-LPX, encoding no antigens at all. (c) Gp70-AH1 tetramer+ CD8+ T cells in treated mice (n = 7–10/group). (d, e) Phenotypic analysis of enriched splenic CD4+ T cells from mice immunized with CT26 PME1 or control RNA-LPX (n = 5/group). (d) Differential expression of ICOS, CD69, PD-1, CD62L, T-bet, CD25 on ME1-specific (ME1tet+) and -nonspecific (ME1tet−) CD4+ T cells as determined by flow cytometry. Representative pseudocolor plots of ME1 tetramer staining are shown. (e) Supernatant cytokine secretion after 48 h co-culture of CD4+ T cells with ME1-peptide-loaded BALB/c BMDC. (f) IFNγ intracellular cytokine staining after ex vivo re-stimulation of enriched splenic CD4+ T cells from CT26-tumor-bearing mice, locally 12 Gy irradiated at a mean tumor volume of 60 mm3 and immunized with CT26 PME1 or control RNA-LPX, with ME1 peptide-loaded BMDC (n = 6/group). Significance was determined using (b) Mantel-Cox log-rank test, (c, d, f) one-way ANOVA, Tukey’s multiple comparison test and (e) unpaired, two-tailed Student’s t-test. (a) Tumor growth is displayed on a log2-scale. Ratios depict frequency of mice with complete tumor responses (CR). Mean±SEM.
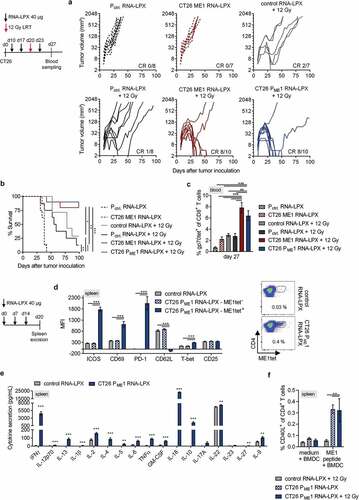
Figure 3. Adding the CD4 neoantigen vaccine to LRT results in a potent polyantigenic CD8+ T cell response and T cell memory. (a) IFNγ ELISpot using splenocytes isolated from CT26 tumor-bearing BALB/c mice, vaccinated with CT26 PME1 or control RNA-LPX and locally irradiated at a mean tumor volume of 45 mm3 (n = 6 mice/group, 2 mice pooled each), against CT26 cells, gp70-AH1 peptide-pulsed BALB/c BMDC, CT26-gp70KO, and 20 Gy irradiated CT26-gp70KO cells. In vitro irradiation was performed to enhance tumor cell MHC class I presentation (Supplementary Figure 3(a)). (b-d) CT26-gp70KO tumor growth (b) and survival (c) of mice immunized with CT26 PME1 or control RNA-LPX and irradiated at a mean volume of 45 mm3 (n = 7–10/group). (d) IFNγ ELISpot using splenocytes isolated from CT26 tumor-bearing mice (n = 4 mice/group, 2 mice pooled each) against CT26 cells, 20 Gy irradiated CT26-gp70KO cells and gp70-AH1 peptide-pulsed BALB/c BMDC. As in (a), in vitro irradiation was performed to enhance tumor cell MHC class I presentation (Supplementary Figure 3(a)). (e) Survival of 12 Gy and CT26 PME1/ME1 RNA-LPX treated CT26 tumor-free mice, challenged with a tumorigenic dose of CT26-gp70KO cells 40 days after initial tumor rejection (n = 10 each). Naïve BALB/c mice served as control group (n = 10). Significance was determined using (c, e) log-rank test and (a, d) one-way ANOVA, Tukey’s multiple comparison test. (b) Tumor growth is displayed on a log2-scale. Ratios depict frequency of mice with complete tumor responses (CR). Mean±SEM.
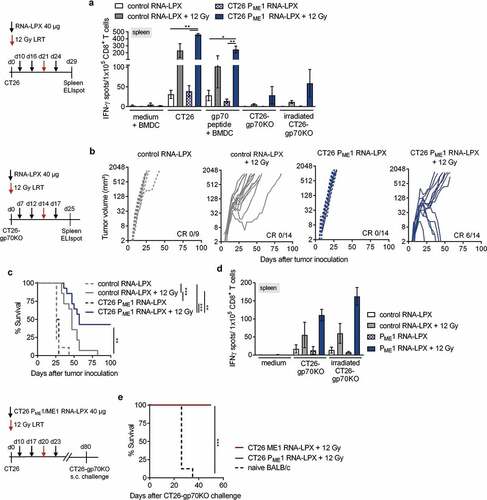
Figure 4. Tumor immune infiltrates of CD4 neoantigen vaccine/LRT-treated mice consist of activated, tumor antigen-specific CD8+ T cells and vaccine-induced CD4+ T cells capable of providing cognate help. (a, b) Analysis of TIL in CT26 tumor-bearing BALB/c mice (n = 5–6/group) treated with 12 Gy at a mean tumor volume of 45 mm3 and immunized with CT26 PME1 or control RNA-LPX. Tumors were resected 8 days after LRT. (a) Percentage of CD45+, tumor cells, CD4+ and CD8+ T cells and (b) gp70-AH1 tetramer+ CD8+ T cells. Representative pseudocolor plots show gp70-AH1 tetramer staining. (c-e) Analysis of tumor-infiltrating CD8+ T cells (c, d) and CD4+ T cells (e) from CT26 tumor-bearing mice locally irradiated with 12 Gy at a mean tumor volume of 60 mm3 and immunized three times with CT26 PME1 or control RNA-LPX (n = 6/group). CD4+ and CD8+ T cells were enriched via CD45+ TIL MACS for (c) phenotypic analysis or (d, e) intracellular cytokine staining after restimulation with gp70-AH1 or ME1 peptide-loaded BALB/c BMDC. Representative pseudocolor plots show CD8+ (d, right) and CD4+ (e, right) T cells after peptide restimulation. (f, g) TCRβ CDR3 sequencing of tumor CD8+ T cells from mice (n = 3–4/group), irradiated with 12 Gy at a mean tumor volume of ~100 mm3 and immunized three times with CT26 PME1 RNA-LPX or control RNA-LPX, analyzed 9 days after irradiation. (g) Number of unique TCRβ sequences in tumors or treated mice (left) and mean TCRβ clonotype frequency (clonality) of CD8+ T cells (right). (f) Frequency of blood-tumor shared TCRβ clones prior and 9 days after LRT compared to all unique tumor clones found 9 days after LRT. Significance was determined using (a–g) one-way ANOVA, Tukey’s multiple comparison test. Mean±SEM.
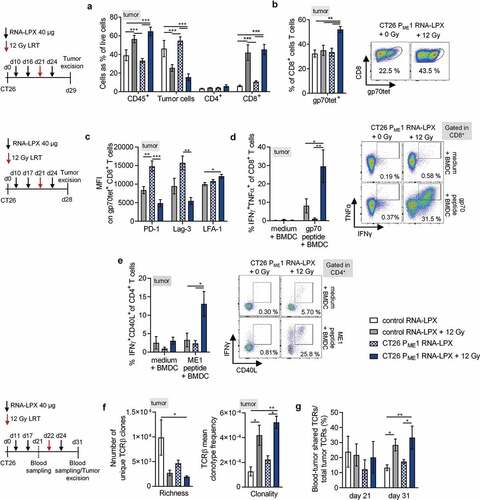
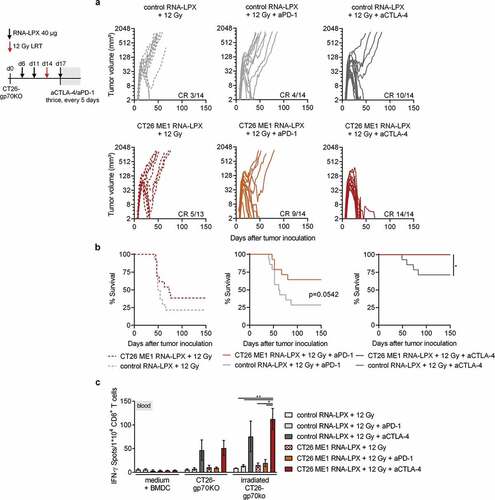
Figure 5. CD4 neoantigen vaccine/LRT treatment followed by anti-CTLA4 antibody therapy further enhances the efficacy with complete remission of gp70-negative CT26 tumors and survival of all mice. (a–c) CT26-gp70KO tumor growth (a) and survival (b) of BALB/c mice (n = 13–14/group) locally irradiated with 12 Gy at a mean tumor volume of 60 mm3, immunized three times with CT26 ME1 or control RNA-LPX and treated with anti-CTLA-4 or anti-PD-1 antibodies 3, 8, and 13 days after LRT. (c) IFNγ ELISpot using peripheral blood lymphocytes against wild-type or irradiated CT26-gp70KO cells (n = 13–14/group, blood of 3–4 mice pooled/data point). Significance was determined using (b) Mantel-Cox log-rank test and (c) one-way ANOVA, Tukey’s multiple comparison test. (a) Tumor growth is displayed on a log2-scale. Ratios depict frequency of mice with complete tumor responses (CR). Mean±SEM.