Figures & data
Figure 1. Codium fragile polysaccharide (CFP) induced activation of bone marrow-derived dendritic cells (BMDCs). BMDCs were differentiated from bone marrow cells following incubation with 100 U/mL IL-4 and 100 U/mL GM-CSF for 6 days. BMDCs were treated with various concentrations of CFP and 0.1 μg/mL of LPS for 24 h. (a) Morphological changes in BMDCs. The images were obtained using a microscope (X 60 of magnification). (b) Mean fluorescence intensity (MFI) of co-stimulators and MHC class I and II measured by flow cytometry. (c) Concentrations of IL-6, IL-12, and TNF-α in culture medium analyzed by ELISA. Data are representative of a larger dataset or are the average of six independent samples (Two samples for three independent experiments). A significant difference from treatment with PBS is indicated by *p < .05, **p < 0.01.
Figure 2. CFP promotes the activation of splenic DCs in mice. C57BL/6 mice were intraperitoneally injected with the indicated doses of CFP. The mice were intraperitoneally injected with 1 mg/kg LPS as a positive control. Six hours after treatment, the spleen was harvested and the activation of splenic DCs was analyzed by flow cytometry. (a) Strategy of spleen DC analysis by flow cytometry. Spleen DCs were defined as CD11c+ lineage− cells among live leukocytes. (b) MFI of co-stimulator and MHC class I and II. (c) MFI of co-stimulator and MHC class I and II in CD8α+ and CD8α− DCs. (d) Serum concentrations of pro-inflammatory cytokines measured by ELISA. Data are the average of six independent samples (two independent experiments performed with n = 3/group). A significant difference from the PBS control group compared to CFP-treated group is indicated by *p < .05, **p < 0.01.
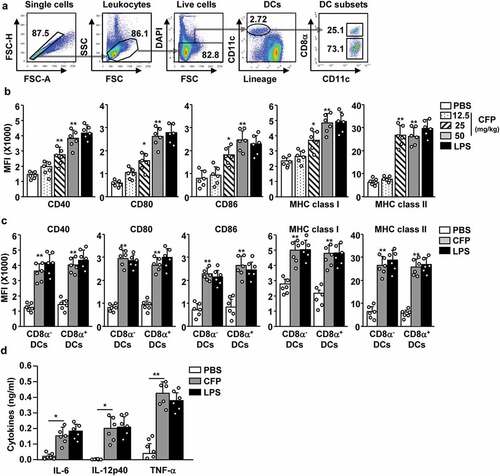
Figure 3. CFP elicited antigen-specific T cell immunity in tumor-bearing mice. C57BL/6 mice were subcutaneously injected with B16-OVA melanoma cells. (a) Strategy behind tdLN DC analysis by flow cytometry. (b) Seven days after tumor injection, mice were intraperitoneally treated with 50 mg/kg CFP, and levels of co-stimulator and MHC class I and II were measured. (c) Serum concentrations of pro-inflammatory cytokines were determined. (E to G) OT-I and OT-II cells were transferred into B16-OVA tumor-bearing CD45.1 congenic mice. One day after cell transfer, mice were intraperitoneally injected with PBS, 2.5 mg/kg OVA, 50 mg/kg CFP, or a combination of OVA and CFP. (d) OT-I and OT-II cell proliferation was measured in tdLN 3 days after treatment. (e) Mean cell numbers of tumor-infiltrated OT-I and OT-II cells. (f) Intracellular IFN-γ and TNF-α levels in tumor-infiltrating OT-I and OT-II cells measured by flow cytometry. (g) Mean IFN-γ-producing (left panel) and TNF-α-producing (right panel) OT-I and OT-II cells in tumor tissues. All data are representative or show the average of six independent samples (two independent experiments performed with n = 3/group). A significant difference from the PBS treatment and CFP treatment is indicated by **p < 0.01.
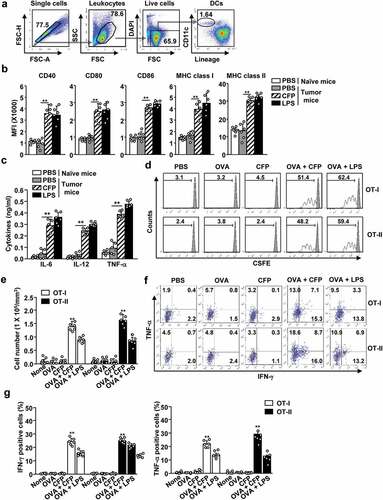
Figure 4. Treatment with a combination of CFP and OVA suppressed B16-OVA tumor growth. C57BL/6 mice were subcutaneously inoculated with B16-OVA. The mice received treatment with PBS, 2.5 mg/kg OVA, 50 mg/kg CFP, or a combination of OVA and CFP on days 7 and 14 after tumor injection. (a) B16-OVA tumor growth curves. (b) Images of tumor mass on day 21 after tumor injection. (c) IFN-γ production by tdLN cells in response to MHC class I-restricted epitope OVA peptide (257–264) (left panel) and MHC class II epitope (323–339) measured by ELISPOT. (d) OVA-specific cytotoxic activity. Data are representative or show the average of six independent samples (two independent experiments performed with n = 3/group). A significant difference from the PBS treatment compared to CFP treated group is indicated by **p < 0.01.
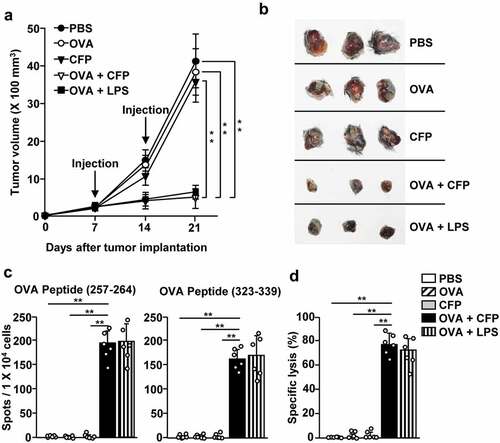
Figure 5. CFP induced melanoma antigen-specific immunity and inhibited melanoma tumor growth. C57BL/6 mice were subcutaneously injected with B16 cells and intraperitoneally treated with PBS, 2.5 mg/kg TRP2, 50 mg/kg CFP, or a combination of TRP2 and CFP on days 7 and 14 after tumor injection. (a) Tumor growth curves. (b) Size of tumor masses was determined on day 21 after tumor injection. (c) IFN-γ production levels in response to TRP2. (d and e) Once B16 tumors were well established, by day 7, the mice were depleted of CD4 or CD8 expressing cells and treated with a combination of TRP2 and CFP. (d) Tumor growth curves after CD4 (d) or CD8 T (e) depletion. Each condition had three mice and each experiment was conducted twice (n = 6), **p < 0.01.
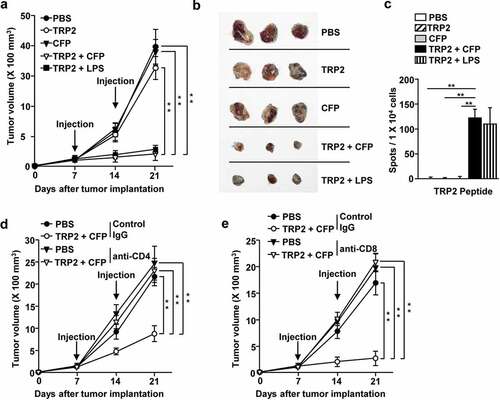
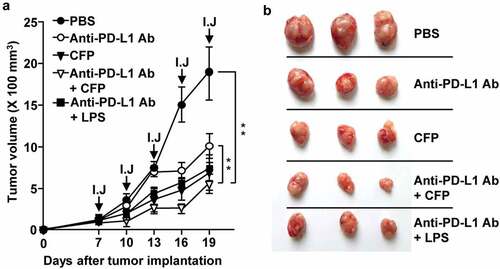
Figure 6. CFP enhanced the antitumor effect of an anti-PD-L1 antibody. BALB/c mice were subcutaneously injected with CT-26 carcinoma cells. The mice were intraperitoneally treated with 10 mg/kg anti-PD-L1 antibody, 50 mg/kg CFP, or a combination of anti-PD-L1 and CFP for 3 days. I.J indicates injection. (a) Tumor growth curves (b) Size of tumor mass on day 19 after tumor injection. Three mice for each condition and a total of two experiments means that n = 6 for these evaluations, **p < 0.01.