Figures & data
Figure 1. (a). The protocol schema for the phase I, which included colorectal cancer and pancreatic cancer patients, is shown with infusions of EGFRBi armed T cells (BATs) with restaging 4 weeks after the last infusion of BATs and a boost of BATs. 1b) Protocol schema for the phase II with 2 infusions per week for 4 weeks in combination with low dose IL-2 and GM-CSF. 1 c) The overall survival and time to progression for the 7 patients. 1d) CT scan of patient IT20102 before immunotherapy (upper and lower left panels) and after immunotherapy (upper and lower right panels) with stable disease and a decrease in size by 27%; 1e) CT scan of patient IT20104 before immunotherapy, persistence of the lesion after 5 months of immunotherapy, and complete response by 7 months post immunotherapy that persisted almost 2 years; 1 f) CT of patient IT20121 shows stable disease before IT to 25 months after enrollment.
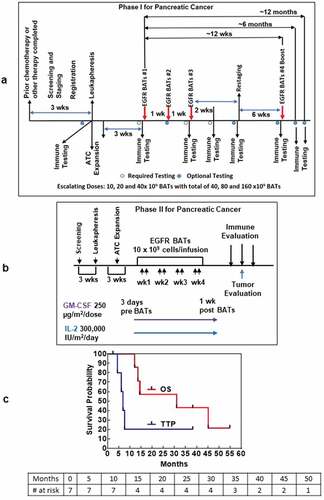
Figure 1. (Continued).
Table 1. Toxic reaction incidence and grade by dose level in phase I study.
Table 2. Toxic reaction incidence and grade by dose level in phase II study.
Table 3. Patient characteristics.
Figure 2. (a).PBMC from all seven PC patients were tested for direct cytotoxicity and IFN-γ Elispots responses against MiaPaCa-2 and five phase I patients were tested against NK cell targets K562 for cytotoxicity and IFN-γ Elispots responses; 2b) Shows the highest specific (MiaPaCa-2) and innate (K562) cytotoxic and IFN-γ Elispots responses postIT compared to preIT base line responses; 2 c) IP-10 and IL-8 tested before and after immunotherapy in 7 patients; 2d) PBMC of patient IT20091 obtained at various time points were left unstimulated (background), stimulated with MiaPaCa-2, or K562. Data are expressed as number of IFN-γ Elispots per million PBMC plated at pre-IT; post BATs infusion #1, #3, and #4; 2 and 4 weeks after infusion #3; pre infusion #4; and post boost infusion at 2 and 4 weeks.
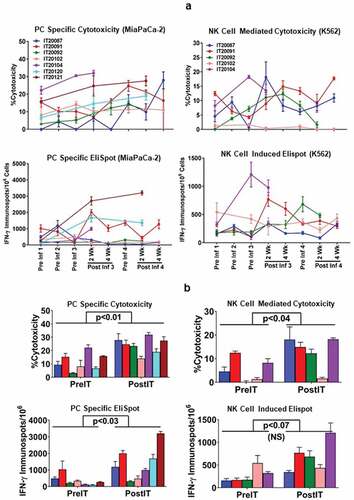
Figure 2. (Continued).
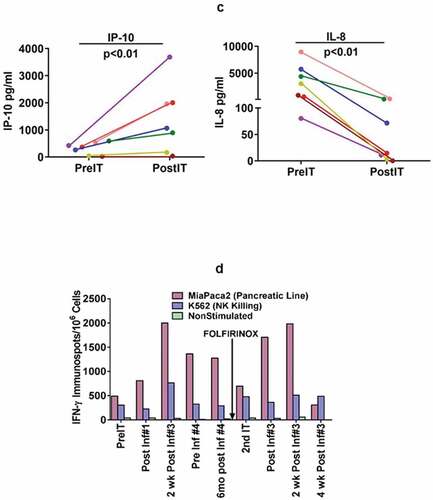
Table 4. Phenotype and characteristics of the apheresis and harvest product.
Table 5. Phenotype of pre and post IT T cell subpopulations and myeloid-derivedd suppressor cells.
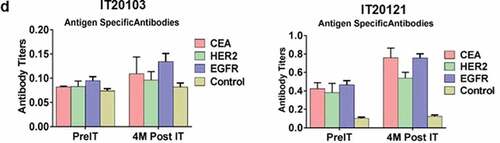
Figure 3. (a) In a pilot screen of the Vβ repertoire of PBMC from IT20091 before and after IT, there was a suggestion that there were shifts in the repertoire that could be detected; 3b) In a subsequent study on IT200121, we asked what members of the Vβ repertoire in CD4 cells would respond to stimulation with MiaPaCa-2 by producing cytoplasmic IFN-γ before IT, in the middle of IT, and after IT. There were no changes seen in the CD4 Vβ repertoire; 3 c) With IT200121, we again asked what members of the Vβ repertoire, this time in CD8 cells, would respond to stimulation with MiaPaCa-2 by producing cytoplasmic IFN-γ before IT, in the middle of IT, and after IT. Enhanced cytoplasmic IFN-γ responses in CD8 cells were seen in Vβ1, 2, 4, 5.1, 13.6, 17, 22, with decreased responses seen in 13.2 after IT. 3d) Serum IgG antibody titers to EGFR, CEA, and HER2 doubled above baseline but were not significant.
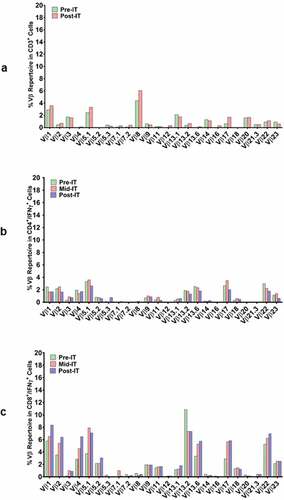
Figure 3. (Continued).