
Figures & data
Figure 1. Co-culture in vitro of cancer stem cells and human monocytes generates hybrid cells.
(a) Pipeline for in vitro fusion assays between cancer stem cells (green) and PBMCs’ isolated monocytes (red, CD14+). (b) Representative FACS analysis (n = 9; GFP+ and PANK+, green; CD14+, red) of hybrids yielding after 5 days of fusion assays with H460GFP-CSC (tangerine in left panel, GFP+CD14+) and A549-CSC (tangerine in right panel, PANK+CD14+). (c) Representative confocal images of double-positive events with vital colorants DIO (green, H460-CSC), DID (red, monocytes) and DAPI for nuclei (blue), after 5 min (i), 15 min (ii), 30 min (iii) and 1 h (iv) of co-culture (left panel); arrows indicate double-positive events (co-localization, tangerine), n = 3. In the right panel, the representative image at 1 h (iv) in the left panel, is first unmerged for the three channels (v, blue; vi, green; vii, red) and then magnified (4x) to clearly showing merged (viii) colors in a hybrid cell. (d) Representative overlay of histograms for FACS analysis of resulting fusions between human monocytes and H460-CSC (green, DIO+) vs. H460 (red, DID+) in the left panel, and A549-CSC (green, DIO+) vs. A549 (red, DID+) in the central panel, in a competition assay in which equal quantities of DIO+ and DID+ tumor cells were co-cultured with CD14+ monocytes for 5 days (ratio tumor cells:monocytes = 1:10). In the right panel, statistical resume of the results (n = 3; *p < .05, ***p < .001, two-tailed t-test, data are mean ± SD). (e) Analysis of resulting fusion events between H460GFP-CSC (left) and A549-CSC (right) with lymphocytes (CD3+), Treg (CD25+ FOXP3+), neutrophils (CD16+) and monocytes (CD14+) (for each one, n = 3; **p <.01, ****p < .0001, two-tailed t-test, data are mean ± SD). (f) Analysis of hybrids yielding from fusions between H460GFP-CSC (left) and A549-CSC (right) with monocytes or macrophages (bordered bars) after 5 days of co-cultures.
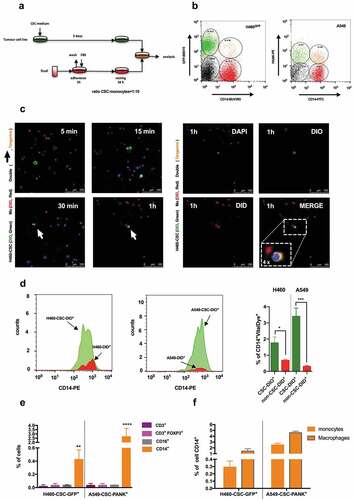
Figure 2. Fused-cells exhibit a patent entity.
(a) Representative confocal images of co-cultures between DAPI-labeledd H460GFP-CSC and EdU-labeled monocytes (630x magnification, scale 25 μm): DAPI (blue), EdU plus secondary Alexa-647 (purple), GFP (green). First row: (left) lone control H460GFP-CSCs showing green cytoplasm and blue nuclei; (central) lone control monocytes showing purple nuclei; (right) panoramic view of the co-culture. Second row: (left) a co-culture highlighting a fused cell close to a tumor cell; (right) 5x zoom of previous framed cells showing blue/purple fused nuclei, with a green cytoplasm. Third row: three other z-axis planes (z1, z3 and z5, scale 20 μm) of previous picture highlighting (white arrows) fused nuclei. (b) After fusion, cells were sorted and the karyotype of the different fractions checked (CD14+, GFP+ and GFP+CD14+). Differences are marked, salmon circle: losing the trisomy after fusion at the 16 chromosome, clover circle: extra aberrant chromosome A that is lost or starts to disappear after fusion. (c) Representative electron-microscopyy photographs: (i) panoramic view of the co-culture, highlighting monocytes (m), dying tumor cells (H0), live tumor cells (h) and hybrids (THC); (ii) a fused cell showing dense cytoplasm with heterochromatic nuclei (n), and then magnified (4x) at its left side; (iii) a monocyte close to a live tumor cell; (iv) hybrid with prominent nuclei, pseudopod extensions and lamellipodia; (v) a monocyte close to a dying tumor cell with autophagic vacuoles; (vi) a bi-nuclei hybrid with large numbers of small electron-densee mitochondria, lysosomes, surrounded subcellular organelles and abundant rough endoplasmic reticulum. (d) PCA of row Z-scores showing separation of the four cell populations (naïve CD14+, blue; and the resulting cell populations after fusion protocol and sorter: CD14+, red; CD14+GFP+, tangerine; GFP+, green) (e) Z-score heat-map showing the major gene clusters (I–IV) (f) Differences among the four cell types for clusters (I–IV), mean, **p < .01, ****p < .0001 one-way ANOVA. (g) Protein expression (FACS) of key surface markers to track the cellular components of the fusions: THCs (CD36+CD14+PANK+, tangerine), CSC (CD36+CD14−PANK+, green) and monocytes (CD36+CD14+PANK−, red), representative histograms (n = 3).
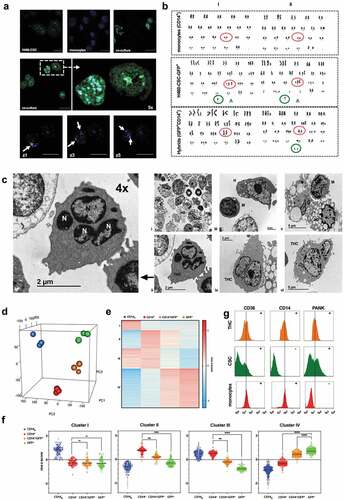
Figure 3. Fusion process efficacy depends on both the regulation of CD36 expression by CSCs and microenvironmental lipids fluctuations, and the oxidative status and M2-phenotype of MΦs.
(a) Relative CD36 mRNA (RT-qPCR) expression of conditioned stem-like H460-CSC vs. native H460 cells, followed-up for 5 days (n = 7, *p = .003, one-way ANOVA/Tukey’s); Insert, FACS percentage of CD36+ cells at the end of the assay (n = 7, *p < .05, two-tailed t-test). (b) Overexpression (FACS) of CD36 in both CSCs (green) and monocytes (red) by 4HNE (n = 3, *p < .05, **p < .01, ***p < .001, two-tailed t-test). (c) Resulting fusion rates after 4HNE incubation; 40 µM was lethal (n = 3, *p = .004, one-way ANOVA/Tukey’s). (d) Specific pCD36 overexpression on CSCs (green) or monocytes (red) ((n = 3, *p = .018, **p = .014, two-tailed t-test). (e) Resulting fusion rates with CD36 overexpressing CSCs (brown) or monocytes (light orange) vs. a control co-culture (orange) (n = 3, **p = .005, one-way ANOVA/Tukey’s). (f) Two other ways to overexpress CD36 on monocytes (n = 2) and resulting fusion rates with CSCs (n = 2, insert). (g) Specific downregulation of CD36 on CSC (green) or monocytes (red) using siRNA-CD36 (n = 3, **p = .0012, ****p = .0001, two-tailed t-test). (h) Effects of siRNA-CD36 combined with α-CD36 and resulting fusion rates (n = 6, ****p < .0001, two-tailed t-test). (i, j) CD36 CRISPR-engineered KO abolish fusion event. (i) Increased levels of CD36 protein expression (FACS) by wild type A549-CSCs and clone B10, a CRISPR-engineered A549-CD36Δ/Δ–CSC clonal line, after transfection with pCD36 48 h before starting co-cultures with monocytes (n = 4, *p < .05, ***p < .001, two-tailed t-test). (j) Fusion event is rescued after B10 clone starts overexpressing CD36 (n = 4, **p < .01, two-tailed t-test). (k) Effects of stimulation with oxLDL or lactate (at two time-points of fusion: the last 16 h or a total of 96 h) on monocyte oxidative status (n = 4, *p = .02, one-way ANOVA/Tukey’s). (l) CD163 M2-polarization measure of previous monocytes (n = 4, *p = .01, one-way ANOVA/Tukey’s) (m) Resulting fusion rates with previous monocytes (n = 4, *p = .03, one-way ANOVA/Tukey’s). (n) Fusion rates reached under canonical (M1) vs. noncanonical (M2) stimulation of monocytes by either IFN-γ or IL-4, respectively (n = 3, ****p = .006, one-way ANOVA/Tukey’s). (o) Oxidative status of monocytes on both previous conditions (n = 3, *p = .017, one-way ANOVA/Tukey’s). (p, q) Effects of stimulation with LDL or oxLDL, alone or supplemented with tocopherol, as well as the latter alone on monocytes. (p) Oxidative status (n = 3, ***p < .001, two-tailed t-test) and (q) CD64 expression for M2-polarization measurement on CD14+ cells (n = 3, *p < .05, two-tailed t-test). (r) Effects of downregulate CD36 (siRNA-CD36) on H460-CSCs prior to co-culture with monocytes, then stimulating with LDL or oxLDL, alone or supplemented with tocopherol, as well as the latter alone, on hybrids yielding (n = 3, *p < .05, **p < .01, ***p <.0001, one-way ANOVA/Tukey’s). Data in A-R are mean ± SD.
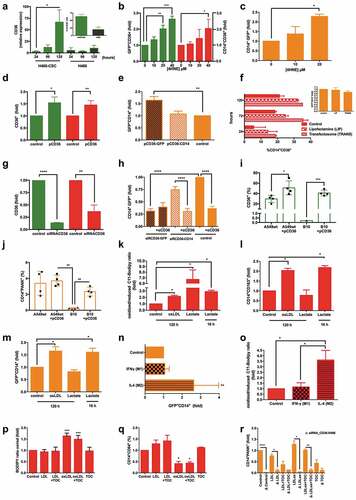
Figure 4. THCs show migration and proliferation capabilities both in vitro and in vivo.
(a) Active and passive migration of the various populations involved in the fusion process. Left insert, a diagram of transwells showing the non-migrated cells (A) in the top chamber, and migrating cells (b) in the bottom chamber. Results for migration of fusion assays components from H460GFP-CSC (center) and A549-CSC (right) co-cultures, performed with (left side of each graph) or without a collagen-covered membrane (right side of each graph). Hybrids (GFP+CD14+ or PANK+CD14+, for H460GFP or A549, respectivelyy), orange bars; CSCs (idem, GFP+ or PANK+), green bars; monocytes, red bars (n = 3, **p < .01, ***p < .001, ****p < .0001, one-way ANOVA/Tukey’s, data are mean ± SD). (B) Proliferation rate differences amongst the three sorted cell types as measured by CFSE dimming after 7 days of growth (n = 3, *p =.01, one-way ANOVA/Tukey’s, data are mean ± SD); and a representative diagram of proliferative cells (insert). (c) After 5 days, co-cultures of H460GFP-CSC and monocytes were sorted and single hybrids seeded on 96-well plates, then followed-up during 20 days (a representative experiment is shown, a 1-day single cell is shown 4x magnified; n = 45); Insert, 20 days old tumors expression of several markers (n = 5, data are mean ± SD). (d) Mice experimental design (left) for in vivo hybrid invasiveness characterization. Lungs and lymph nodes (right) were analyzed for the presence of GFP+ (H460GFP-CSC) and GFP+CD14+ (hybrids) cells after 3, 6 and 28 weeks (n = 5 for each treatment) of i.v. tail inoculation.
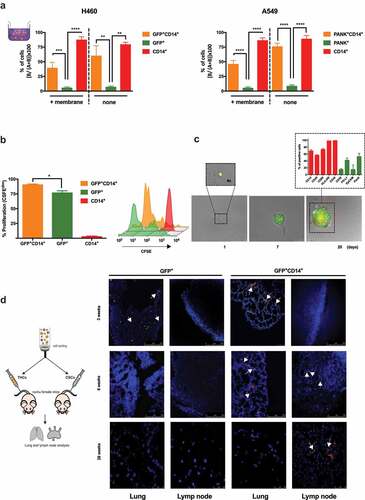
Figure 5. THCs downregulate in vitro immune response.
(a) Pipeline of the procedure to study the immune response. Tumor cells (green) were grown to CSC and co-cultured with monocytes (red); then,n H460GFP-CSCs (green, GFP+), hybrids (orange, GPP+CD14+) and monocytes (red, CD14+) were sorted and independently seeded with either PBMCs or NK cells from HVs. (b, c) Immunogenicity of sorted hybrids vs. H460GFP-CSC, exposed to expanded human NKs, as measured by: (b) perforin generation by CD3−CD56+CD16+ cells (n = 4, ****p < .0001, one-way ANOVA/Tukey’s, data are mean ± SD) and (c) lysis at various NK cells:cell ratios (n = 3, **p < .01, ***p < .001, two-tailed t-test, data are mean ± SD). (d) Protein expression (FACS) of intracellular TGFβ in hybrids (orange), H460GFP-CSCs (green) and monocytes (red); n = 5. (e, f) CFSE-labeled PBMCs from HVs were exposed (ratio 1:5) to sorted hybrids (orange, GFP+CD14+), H460GFP-CSC (green, GFP+) and monocytes (red, CD14+): (e) representative graphs for mitogen-induced proliferations, defined as CFSEdim, of both CD4+ (left) and CD8+ (right) cells, and (f) statistical resume of the data (n = 4, **p < .01, ***p < .001, ****p < .0001 two-tailed t-test, data are mean ± SD). (g, h) CFSE-labeled PBMCs from HVs were stimulated with pokeweed (PWD) and exposed (ratio 1:5) to lone sorted hybrids (GFP+CD14+) or added with either αPD-1, αCD39, αCD73, αSigleC5, or a cocktail made of the last three ones: (g) representative graphs for proliferations, defined as CFSEdim, of both CD4+ (left) and CD8+ (right) cells, and (h) statistical resume of the data (n = 4, ****p < .0001, two-tailed t-test, data are mean ± SD). (i) Protein expression of membrane-anchored CD36, SIGLEC5, CD73, CD39 and PD-L1 (empty black bars) in hybrids (empty orange bar, left of the dotted line); n = 5 (data are mean ± SD).
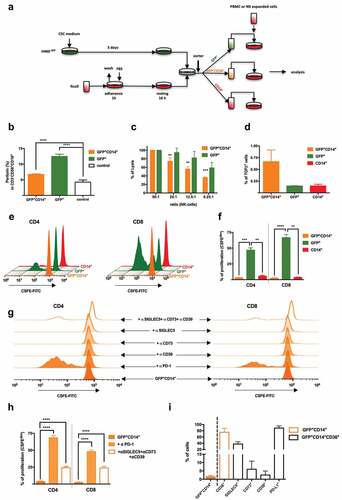
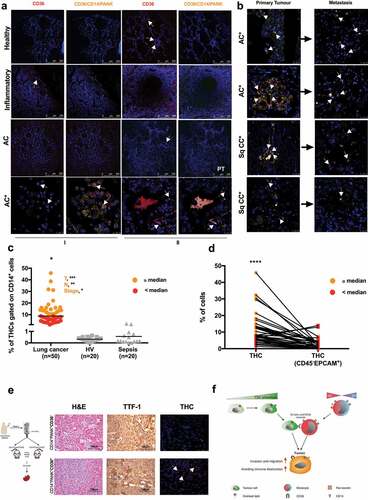
Figure 6. THCs specific markers signatures in patients with lung cancer.
(a) Expression of CD36 and co-localization of the signature CD36/CD14/PANK on lung tissue samples from two sets (I and II) of controls, and patients with: non-tumor-related cancer inflammatory disease (inflammatory), adenocarcinoma (AC) and metastatic adenocarcinoma (AC*) (representative cases from n = 87; see Supplemental Table 2). (b) Co-localization of the signature CD36/CD14/PANK on primary tumor and metastasis samples from patients with metastatic adenocarcinoma (AC*) and squamous carcinoma (SqCC*) (representative cases from n = 87, see Supplemental Table 2 and Supplemental Figure 12). (c) Percentage of THCs, PANK+CD36+ on gated CD14+ circulating cells from patients with lung adenocarcinoma (n = 50) vs. healthy volunteers (HV, n = 20) or patients with sepsis (n = 20) (*p <.0001, one-way ANOVA). Two groups are shown according to median (tangerine dots > median, red dots ≤ median), being that above median in significant correlations with primary tumor size (T, ***p < .001), spread to lymph nodes (N, **p = .001) and stage (*p = .025), as ranked by Spearman’s coefficient. (d) Percentage of THCs that exhibited the main characteristic of CTCs (CD45−EPCAM+) (****p <.0001, paired t-test). (e) Mice experimental design (left) for in vivo invasiveness characterization of THCs (CD36+CD14+PANK+) vs. non-THCs (CD36−CD14+PANK+) cells isolated from lung cancer patients’ PBMCs. Spleens (right) were analyzed for histopathological changes (haematoxylin/eosin, H&E), metastatic thyroid transcription factor-1 (TTF-1) expression and the presence of metastatic THCs (CD36+CD14+PANK+), 28 weeks (n = 3 for each treatment) after inoculation (also see Supplemental Table 4). (f) Schematic diagram of the proposed mechanism for Trojan horse cells (THC)-driven metastatic fusion.
Supplemental material