Figures & data
Figure 1. Characterization of the expression of HLA-I APM components in melanoma cell lines.
Figure 2. Correlation of TAP1 and HLA-A expression with the survival probability in metastatic melanoma patients.
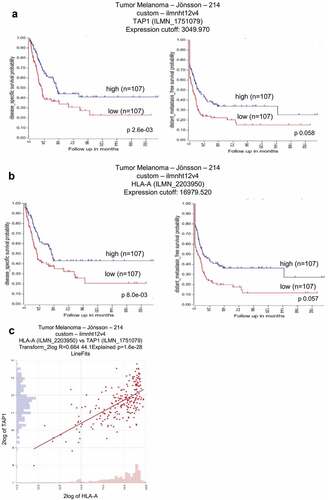
Figure 3. Identification of miR-200a-5p interaction with the 3ʹ-UTR of TAP1.
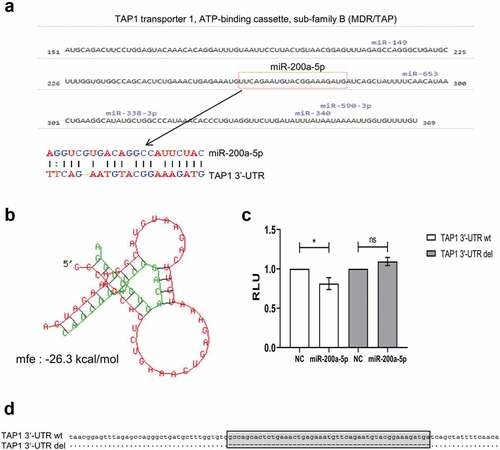
Figure 4. Basal expression of miR-200a-5p and TAP1 in different melanoma cell lines.
Figure 5. Effect of miR-200a-5p overexpression on TAP1 expression in HEK293T cells.
Figure 6. Effect of miR-200a-5p overexpression on the expression of HLA-I APM components in melanoma cell lines.
Figure 7. Increased recognition of miR-200a-5p overexpressing FM3 melanoma cells by NK cells.
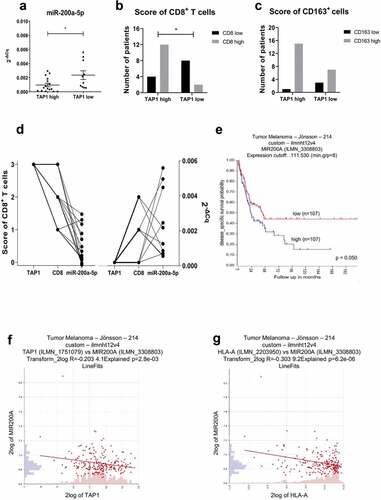
Figure 8. Inverse correlation of miR-200a-5p expression with TAP1 levels and survival probability in melanoma patients.