
Figures & data
Figure 1. Flow diagram of patient recruitment process.
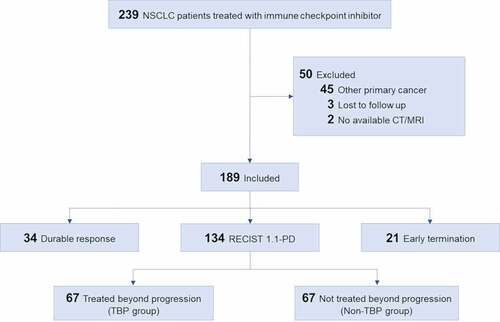
Table 1. Baseline characteristics of patients.
Table 2. Patterns and outcomes of patients with pseudoprogression.
Figure 2. Spider plot of tumor burden changes during ICI treatment in seven patients with PsP. Asterisks indicate the increase of non-target lesions (PsP2, PsP4, PsP6) or the occurrence of new lesion (PsP1) at the time of 1st PD per RECIST 1.1. Except one patient who experienced PsP at 29.3 months (PsP1), the time from baseline to PsP was approximately 3 months (average, 3.2 months; range, 1.9–5.0 months). The time from PsP to reset of all seven pseudoprogressors was approximately 3 months (average, 2.4 months; range, 1.2–5.8 months).
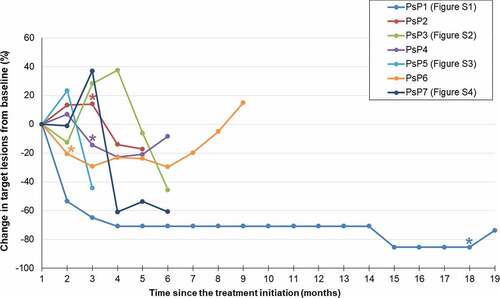
Figure 3. Impact of PsP on progression-free survival in patients treated with immune checkpoint inhibitors. (a) Kaplan–Meier curves of PFS in patients with PsP (n = 7) and without PsP (n = 182). PFS was significantly longer in the seven patients with PsP (median, not reached) than in the 182 patients without PsP (median, 3.8 months; 95% CI, 3.9–4.6 months, P = .02) (b) Kaplan–Meier curves of PFS according to RECIST 1.1 and iRECIST. There was no significant difference between PFS according to RECIST 1.1 (median, 3.8 months; 95% CI, 3.1–4.8 months) and that according to iRECIST (median, 4.1 months; 95% CI, 3.1–5.4 months) (P = .58).
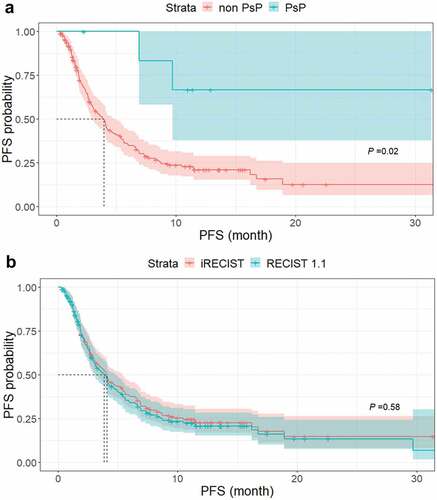
Figure 4. Kaplan–Meier curves of OS in three groups of patients according to response to ICI. There were significant differences in OS among the durable response group (median, not reached), RECIST 1.1-PD group (median, 11.1 months; 95% CI, 9.3 months–not reached) and early termination group (median, 1.3 months; 95% CI, 0.8–1.7 months) (P < .001).
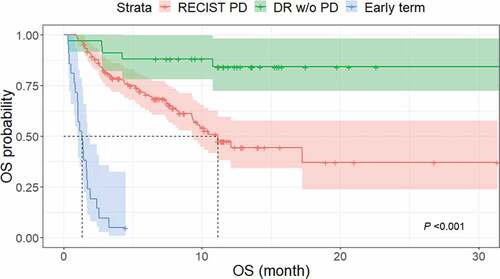
Figure 5. Kaplan–Meier curves of OS in patients with TBP and without TBP. The median OS was significantly longer in the TBP group (17.2 months; 95% CI, 10.2 months–not reached) than in the non-TBP group (7.4 months; 95% CI, 4.4–12.1 months) (P < .001).
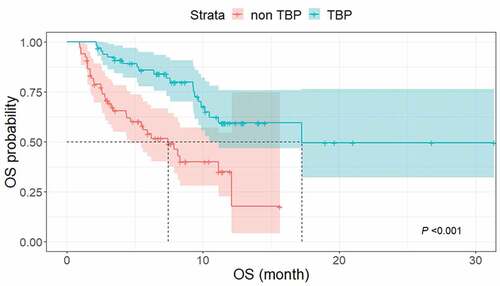
Table 3. Characteristics between TBP and non-TBP patients.
Table 4. Univariate and multivariate Cox proportional hazard analysis of OS in patients with RECIST 1.1-PD.
Figure 6. Kaplan–Meier curves of OS and PFS based on iRECIST to compare outcomes between patients with PsP (n = 7) and non-pseudoprogressors treated with TBP (n = 60). (a) The median OS did not significantly differ (not reached vs. 17.2 months, respectively, P = .2). (b) The median PFS based on iRECIST was significantly different between the two groups (not reached vs. 3.4 months [95% CI, 2.6–4.2 months]) for patients with PsP and non-pseudoprogressor with TBP (P < .001).
![Figure 6. Kaplan–Meier curves of OS and PFS based on iRECIST to compare outcomes between patients with PsP (n = 7) and non-pseudoprogressors treated with TBP (n = 60). (a) The median OS did not significantly differ (not reached vs. 17.2 months, respectively, P = .2). (b) The median PFS based on iRECIST was significantly different between the two groups (not reached vs. 3.4 months [95% CI, 2.6–4.2 months]) for patients with PsP and non-pseudoprogressor with TBP (P < .001).](/cms/asset/9e782db8-c2fc-4b01-99c5-b484d2da9961/koni_a_1776058_f0006_oc.jpg)