
Figures & data
Figure 1. Identification of serum CCL27 in the discovery set.
(a) Heatmap for 42 cytokines and chemokines of 52 serum samples in the discovery set. (b – d) Level of candidate serum cytokines CCL27, VEGF and IL-12(p70) at baseline and during BCG induction therapy. The patients were stratified by the response to BCG. Repeated measures design (General Linear Model) for the overall P value and Mann–Whitney U tests for single time point comparisons. Interleukin = IL, vascular endothelial growth factor = VEGF.
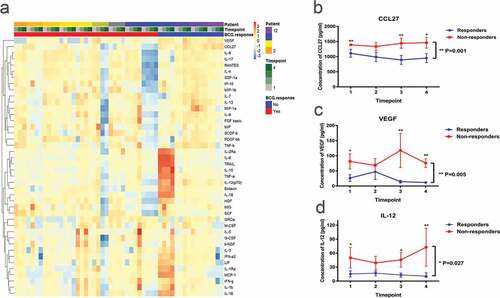
Table 1. Patients characteristics in validation cohort stratified by treatment response to BCG.
Table 2. Patients characteristics in validation set stratified by baseline level of serum CCL27.
Figure 2. Baseline levels and dynamic change of serum CCL27 may predict the treatment response to intravesical BCG immunotherapy in the validation set.
(a) ROC curves and the AUCs for the predictive accuracy of baseline, changes from baseline to last timepoint and combined effect of serum CCL27. (b) Kaplan-Meier recurrence-free survival curves for patients with NMIBC stratified by serum CCL27 at baseline. P-values were determined using a log-rank test. (c) ROC curves and AUC for the predictive accuracy of serum CCL27 at early, medium and last phase of BCG induction immunotherapy. AUC = area under the curve. ROC = receiver operating characteristic. (d) An overview regarding the individual changes from the baseline serum CCL27. (e) Changes of serum CCL27 during BCG induction therapy stratified by “responders” and “non-responders”. A repeated measures design (General Linear Model) for overall P value and Mann–Whitney U tests were used for single time point comparisons. (f) Kaplan-Meier recurrence-free survival curves for patients with NMIBC stratified by combined risk score of serum CCL27. P-values were determined using a log-rank test. AUC = area under the curve. ROC = receiver operating characteristic. Bacillus Calmette-Guerin = BCG.
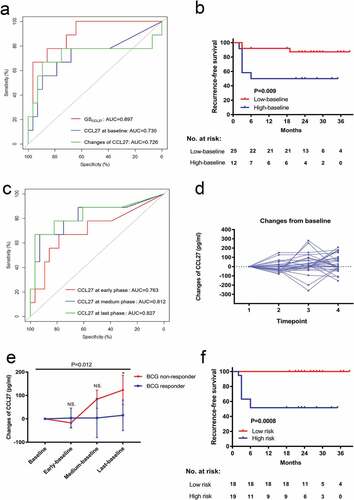
Figure 3. Immunohistochemistry analysis of each immune cell subtype in the tumor microenvironment and its correlation with serum CCL27.
(a) T-bet-positive Th1 cells. (b) GATA-3-positive Th2 cells, (c) CD4-positive T cells. (d) CD8-positive T cells. (e) CD66b-positive tumor-infiltrated neutrophils. (f) CD68-positive tumor-associated macrophages. Scale bar, 100 μmn.
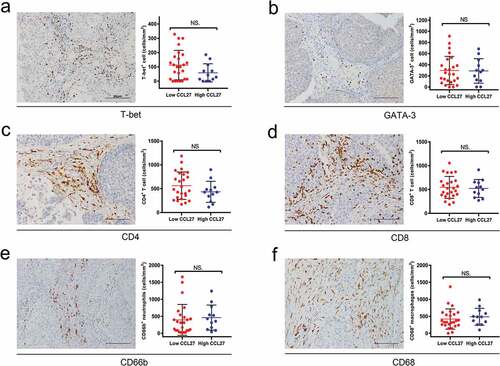
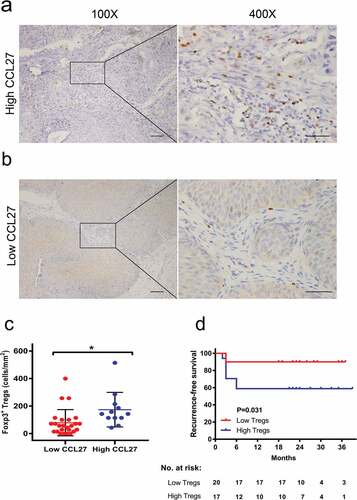
Figure 4. Association between serum CCL27 and regulatory T cells (Tregs) in the tumor microenvironment.
(a-b) Representative images of the immunohistochemical detection of Foxp3 (brown) in patients in the low CCL27 and high CCL27 group. Scale bar 100 μm for 100X images and 50 μm for 400X images. (c) The Foxp3+ Treg densities were higher in the high CCL27 group than in the low CCL27 group (P = .002). (d) Kaplan-Meier recurrence-free survival curves for patients stratified by Foxp3+ Tregs. P-values were determined using a log-rank test. Regulatory T cells = Tregs, Bacillus Calmette-Guerin = BCG, Forkhead box P3 = Foxp3.
Supplemental material