Figures & data
Table 1. Demographics for 294 subjects who initiated chemotherapy within 1 year of TMB.
Figure 1. Consort diagram for study.
Figure 2. Tumor mutational burden vs. SD≥6 months/PR/CR. Data represent the median and 25–75% interquartile range for tumor mutational burden. Patients with SD≥6 months/PR/CR after chemotherapy had similar tumor mutational burden to those with progression disease (PD) or SD<6 months (median (25–75%): 5 (3–7.5) vs. 5 (2–8) mutations/megabase; p = .22). Patients with stable disease who were censored prior to 6 months of evaluation were excluded from the analysis.
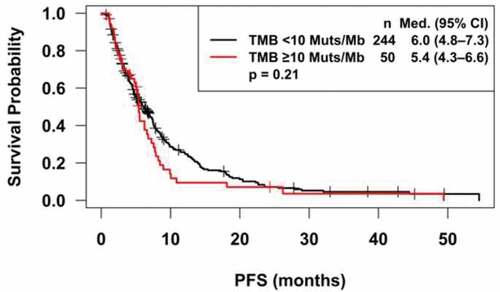
Figure 3. Kaplan Meier survival analysis. Progression-free survival for patients with tumor mutational burden of 10 or greater is similar to those with TMB less than 10 (p = .21).