Figures & data
Figure 1. Circulating monocyte subsets before and after RUX therapy. Gating strategy for identification of human monocyte subsets (Classical-, Intermediate- and Non-Classical-monocytes), including (from left to right) live cells detection, doublet exclusion, size discrimination, selection of HLA-DR+ cells, exclusion of double-negative CD14−CD16− cells (selection of Total monocytes) and monocytes separation according to expression of CD14 and CD16 (a). Frequency of circulating monocyte subsets (Classical (b), Intermediate (c) and Non-Classical (d)-monocytes, according to CD14/CD16 expression) in PBMCs of healthy donors (HD; n = 30) and MF patients at baseline (MF baseline T0; n = 30) and after 6 months of RUX therapy (MF RUX (T6 m); n = 20). Bars represent the mean percentage of monocyte subsets in total CD14+/HLA-DR+ monocytes ± S.E.M. (Kruskal-Wallis test and Friedman test, as appropriate; *p < .05; Mo = monocytes).
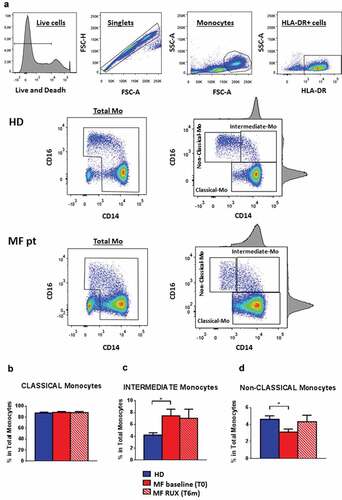
Figure 2. Chemokine receptors expression of monocytes before and after RUX therapy. Percentages of CCR2+ (a), CX3CR1+ (b) and CCR5+ (c) cells in total monocytes and of the three subsets (Classical-, Intermediate- and Non-Classical-monocytes) from PBMCs of healthy donors (HD; n = 30) and MF patients at baseline (MF baseline T0; n = 30) and after 6 months of RUX therapy (MF RUX (T6 m); n = 20) were analyzed. Bars represent the mean percentage of chemokine receptors-positive monocytes ± S.E.M. (Kruskal-Wallis test and Friedman test, as appropriate; *p < .05; **p < .01; ***p < .001; Mo = monocytes). Below, representative histograms of CCR2, CX3CR1 and CCR5 expression of the monocyte subsets of one MF patient (MF baseline (T0)) and one healthy donors (HD) are shown. Isotype control (black), Classical- (dark blue), intermediate- (blue) and Non-Classical-monocytes (light blue) are shown superimposed on each other.
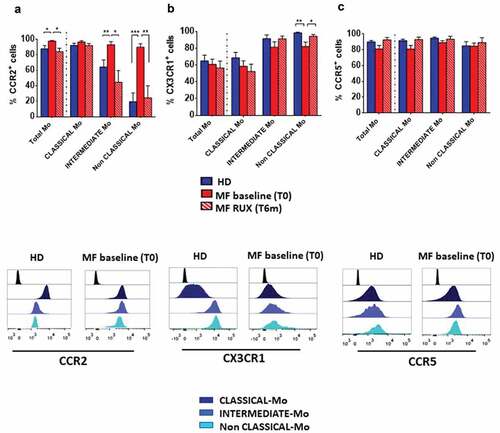
Figure 3. Inflammatory cytokine receptors expression of monocytes before and after RUX therapy. Percentages of TNF-α-R1+ (a), TNF-α-R2+ (b), IL10-R+ (c) cells in total monocytes (identified by CD14 and HLA-DR expression) and of the Classical-, Intermediate- and Non-Classical-monocytes from PBMCs of healthy donors (HD; n = 30) and MF patients (n = 30) at baseline (MF baseline T0) and after 6 months of RUX therapy (MF RUX (T6 m); n = 20) is shown. Bars represent the mean percentage of the cytokine receptors-positive monocytes ± S.E.M. (Kruskal-Wallis test and Friedman test, as appropriate; *p < .05; **p < .01, ***p < .001; Mo = monocytes).
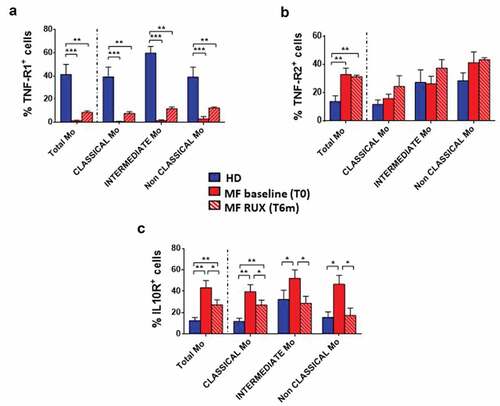
Figure 4. Intracellular monocyte production of inflammatory cytokines before and after RUX therapy. Intracellular production of pro-inflammatory cytokines in total monocytes from PBMC of healthy donors (HD; n = 30) and MF (n = 30) PBMCs (at baseline (MF baseline T0) and after 6 months of RUX therapy (MF RUX (T6 m); n = 20) with or without LPS stimulation (4 hours) is shown. Above, representative histograms identify the IL1β (a), TNF-α (b) and IL6 (c) positive total monocyte of one healthy donors (HD) and one MF patient (at baseline (T0) and after 6 months of RUX therapy (T6 m)) in the presence or absence of LPS stimulation. Unstimulated (blue) and LPS-stimulated (light blue) monocytes are shown superimposed on each other. Below, bars represent the mean percentage of monocytes producing IL1β (A), TNF-α (B) and IL6 (C) ± S.E.M. (Two-way ANOVA test; ***p < .001).
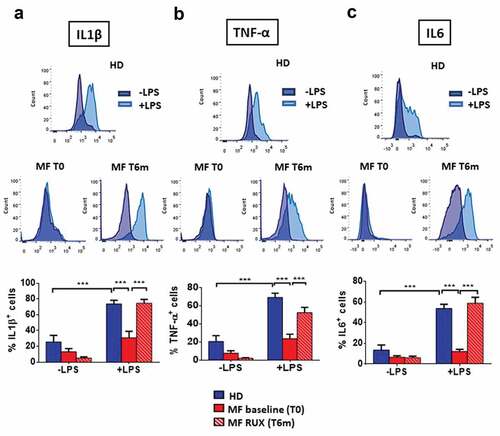
Figure 5. Monocyte secretion of free inflammatory cytokines before and after RUX therapy or in vitro RUX treatment. Concentrations of crucial cytokines (IL1β, TNF-α, IL6, IL10) in the supernatants of immunomagnetically isolated monocytes from healthy donors (HD; n = 20) and MF patients at baseline ((MF baseline T0; n = 20) and after 6 months of RUX therapy (MF RUX (T6 m); n = 20) in vitro cultured for 4/24 hours in the presence or absence of LPS stimulation. Bars represent the mean concentration of IL1β (a), TNF-α (b), IL6 (c) and IL10 (d) ± S.E.M (Two-way ANOVA test; *p < .05, **p < .01, ***p < .001). “-LPS” represents the concentrations of cytokines after 4 or 24 hours without LPS. Panels (e-h) show the concentrations of crucial cytokines (TNF-α and IL10) in the supernatants of immunomagnetically isolated monocytes from healthy donors (HD; n = 20; panels E, G) and MF patients (n = 20; panels F, H) in vitro cultured for 24 hours in the presence or absence of LPS stimulation and titrating doses of RUX (0.2–10 µM). Bars represent the mean concentration of TNF-α and IL10 ± S.E.M (one-way ANOVA test; *p < .05, **p < .01, ***p < .001).
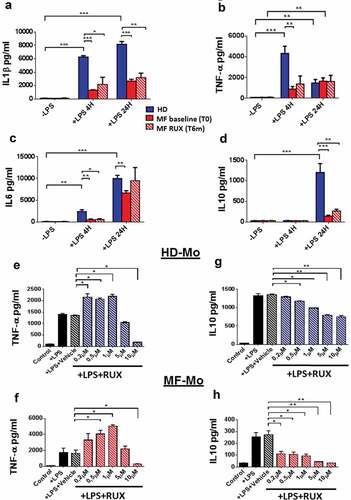
Figure 6. Cytokine-positive EVs secretion of monocytes before and after RUX therapy. Gating strategy, based on beads calibration and size, for identification of monocyte-derived EVs (BIG EVs: 500–900 nm) by flow cytometry and representative dot plot of the IL1β, TNF-α, IL6 and IL10 positive EVs in the supernatants of monocytes from one healthy donors (HD) and one MF patient (at baseline (MF T0) and after 6 months of RUX therapy (MF T6 m) after LPS stimulation are shown (a). Histograms show the expression of surface-bound IL1β (b), TNF-α (c), IL6 (d) and IL10 (e) of EVs in the supernatants of immunomagnetically isolated monocytes from healthy donors (HD; n = 20) and MF patients at baseline (MF baseline T0; n = 20) and after 6 months of RUX therapy (MF RUX (T6 m); n = 20), in the presence/absence of LPS stimulation (24 hours). Bars represent the mean percentage of monocyte-derived cytokine-positive EVs ± S.E.M. (Two-way ANOVA test; ***p < .001).
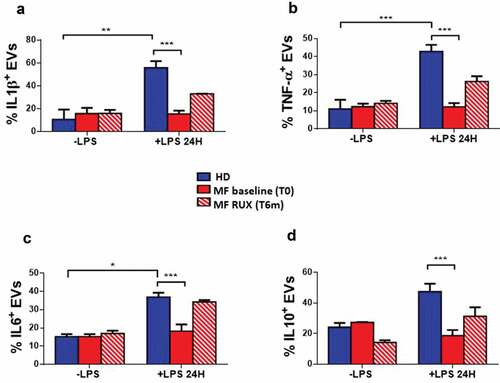
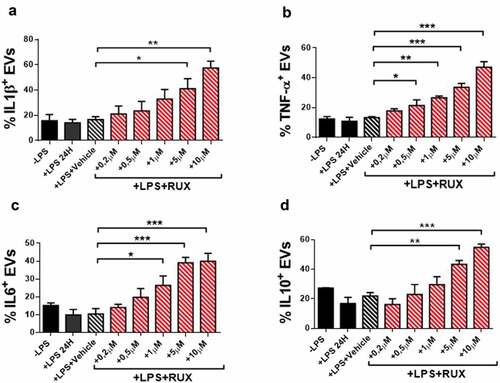
Figure 7. Cytokine-positive EVs secretion of monocytes in the presence or absence of in vitro RUX treatment. Surface-bound IL1β (a), TNF-α (b), IL6 (c) and IL10 (d)-positive EVs in the supernatants of immunomagnetically isolated monocytes from MF patients at baseline (n = 10) in the presence or the absence of LPS stimulation (24 hours) and titrating doses of in vitro RUX treatment or vehicle (DMSO) is shown. Bars represent the mean percentage of monocyte-derived cytokine-positive EVs ± S.E.M. (One-way ANOVA test; *p < .05).