Figures & data
Figure 1. Mutational landscape of significantly mutated genes in triple-negative breast cancer (TNBC) patients.
The left panel indicated gene mutation frequency, the upper panel showed mutational prevalence with respect to synonymous and non-synonymous mutations, the middle panel depicts genes mutation landscape across analyzed cases with different mutation types color coded differently, and the bottom panel displayed clinical features such as signature 1 status, age, histological type, grade, survival status, tumor mutation burden and cohort. New significantly mutated genes were highlighted in upper left bold.
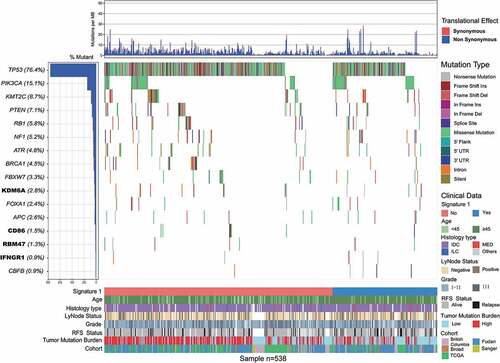
Figure 2. Mutational signatures extracted from the aggregated TNBC dataset.
(a) Lego plot representation of mutation patterns in 538 TNBC samples. Single-nucleotide substitutions were divided into six categories with 16 surrounding flanking bases. The pie chart in upper left showed the proportion of six categories of mutation patterns. (b) The mutational activities of corresponding extracted mutational signatures (Signature 1,3,13 and unmatched, named as COSMIC signature). The trinucleotide base mutation types were on the X-axes, whereas Y-axes showed the percentage of mutations in the signature attributed to each mutation type. (c) The mutational activities of corresponding mutational signatures showed in pie chart.
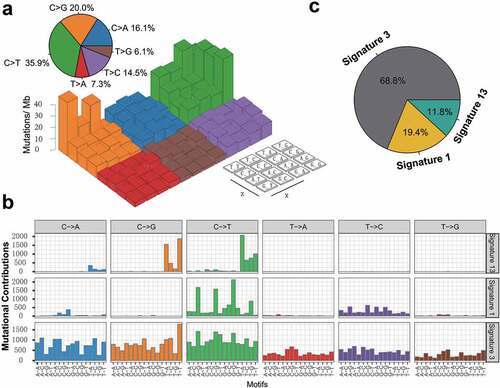
Figure 3. Association of mutational signature 1 with prognosis in TNBC cohort.
(a) Kaplan-Meier survival analysis classified by mutational signature 1 status. (b) Multivariate Cox regression analysis of signature 1 with age, grade, histological type and lymph node status taken into account.
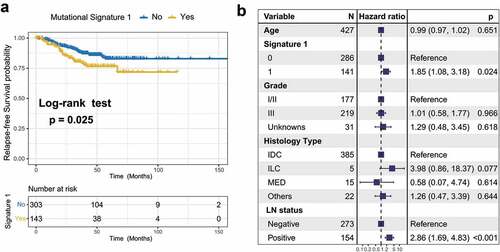
Figure 4. Significantly enriched pathways and immune infiltration alteration with signature 1 activities.
(a) Top enriched pathways in distinct signature 1 activity groups (no vs yes) was assessed by using GSEA. (b) Correlation between signature 1 activities and IPS. Distribution of T cell-inflamed GEP scores (c) and mutant-allele tumor heterogeneity (MATH) score (d) with respect to signature 1 status in TNBC. (e) Tumor infiltrating lymphocytes (TILs) level with signature 1 in TNBC were estimated by CIBERSORT algorithm. All comparison was calculated by Wilcoxon rank-sum test.
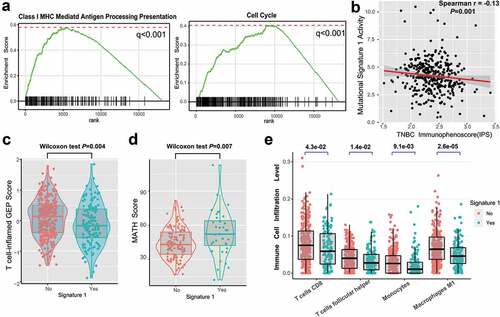
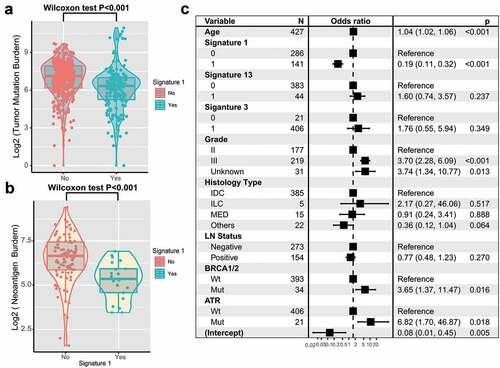
Figure 5. Association of signature 1 with tumor mutation burden in pooled TNBC cohort.
Tumor mutation burden (a) and neoantigen burden (b) were stratified by mutational signature 1. (c) Multivariate logistic regression analysis of signature 1 mutation with TMB after adjusted for age, grade, histological type, lymph node, mutational signatures, and mutations in BRCA1/2 and ATR. Square data markers indicated estimated hazard ratios. Error bars represent 95% CIs.