Figures & data
Figure 1. Effects of hydroxychloroquine plus azithromycin on naïve mice. Tumor-free mice were treated interperitoneally (i.p.) with hydroxychloroquine (HCQ), orally fed with azithromycin (AZI, supplied at different concentrations in the drinking water), or their combination (Combo) as illustrated in the scheme (a). The bodyweight of the mice was monitored every 2 ~ 3 days and the ratios to the 1st measurement at different time points are summarized as line chart (b), mean ± SEM, n = 10 mice/group; **P < .01, and ***P < .001, two-way ANOVA test, compared to the Water group). Livers and hearts were excised from 3 mice of each group at 4 hours after the second injection of HCQ and subjected to protein extraction for SDS–PAGE and immunoblot (c, d). β-Actin (ACTB) was measured as a loading control. Band intensities were measured to quantify the ratio of LC3-II to LC3-I (LC3-II/LC3-I) and p62 to ACTB (p62/ACTB). Data are expressed as means ± SEM of three mice (e, f). Statistical significance is indicated as *P < .05, **P < .01, and ***P < .001 as compared with untreated control (CTRL) (Student’s t-test).
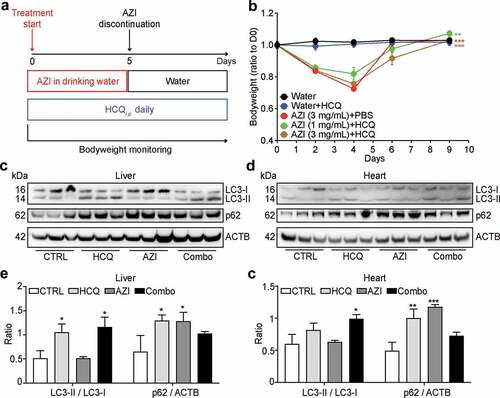
Figure 2. Influence of hydroxychloroquine plus azithromycin on the efficacy of anticancer chemotherapy. Subcutaneous MC38 colorectal cancers were established and interperitoneally (i.p.) treated with oxaliplatin (OXA) or an equivalent volume of PBS, either alone or in combination with hydroxychloroquine (HCQ, i.p.) plus azithromycin (AZI) in drinking water as illustrated in the scheme (a). The bodyweight of mice was monitored every 2 days and ratios to 1st measurement at different time points are summarized as line charts (b) mean ± SEM). Tumor size was measured every 3 days. Growth curves of individual tumors (c) and different groups (d) mean ± SEM) are shown. Statistical differences are expressed as ***P < .001 as compared to the PBS group (two-way ANOVA test, n = 6 mice/group).
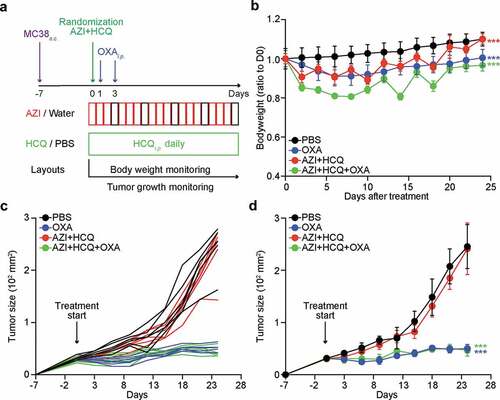
Figure 3. Influence of hydroxychloroquine plus azithromycin on the efficacy of anticancer chemo-immunotherapy. Orthotopic NSCLC were established by intravenous (i.v.) injection of 5 × 10⁵ TC1 cells stably expressing luciferase (TC1 Luc+) and tumor incidence in the lung was detected by bioluminescence. Mice (n = minimum of 8 mice per group) were treated with crizotinib (CRIZ) plus cisplatin (CDDP) or equivalent volumes of PBS, and combined or not with monoclonal antibody to PD-1 (αPD-1) or isotype antibody (ISO), either alone or in combination with hydroxychloroquine (HCQ, i.p.) plus azithromycin (AZI) in drinking water as illustrated in the scheme (a). Bodyweight of mice was measured every 2 days, and tumor size was monitored by luciferase activity every 3 to 4 days. Bodyweight (ration to 1st measurement after randomization) is reported as mean ± SEM (b). Statistical analysis was performed by means of two-way ANOVA test, ***P < .001 as compared to the PBS group (n = 8–11 mice per group). Representative time-lapse images of 3 mice from different groups are reported in (c and d).
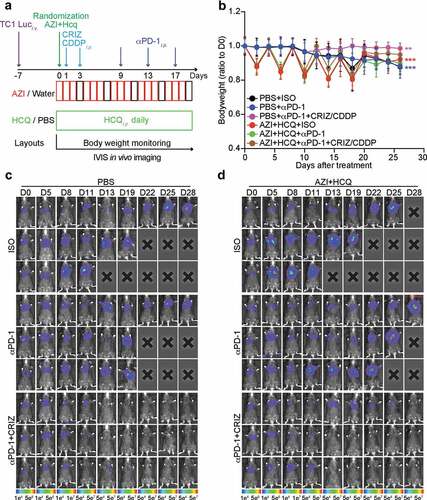
Figure 4. Influence of hydroxychloroquine plus azithromycin on the tumor development control by anticancer chemo-immunotherapy. Mice bearing orthotopic NSCLC were treated with crizotinib (CRIZ) plus cisplatin (CDDP) or equivalent volumes of PBS, and combined or not with monoclonal antibody to PD-1 (αPD-1) or isotype antibody (ISO), either alone or in combination with hydroxychloroquine (HCQ, i.p.) plus azithromycin (AZI) in drinking water. Tumor size was monitored by luciferase activity every 3 to 4 days and quantified as total flux of photons. Individual tumor growth curves are reported in (a, b) Average tumor growth curves (mean ± SEM) of different groups are reported in (c, d) Statistical analysis was performed by means of two-way ANOVA test. Significance are expressed as **P < .01 and ***P < .001 as compared to the PBS group; or ##P < .01 as compared between indicated groups (n = 8–11 mice per group).
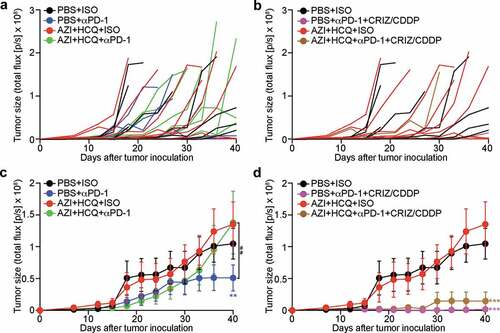
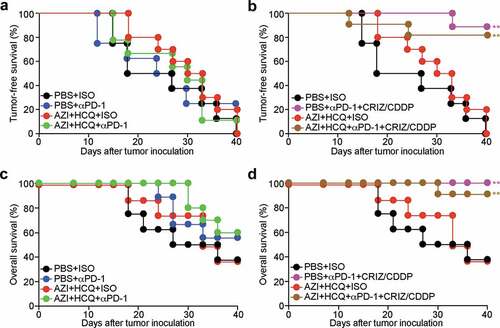
Figure 5. Influence of hydroxychloroquine plus azithromycin on the tumor-free and overall survival of animals treated by anticancer chemo-immunotherapy. Mice bearing orthotopic NSCLC were treated with crizotinib (CRIZ) plus cisplatin (CDDP) or equivalent volumes of PBS, and combined or not with monoclonal antibody to PD-1 (αPD-1) or isotype antibody (ISO), either alone or in combination with hydroxychloroquine (HCQ, i.p.) plus azithromycin (AZI) in drinking water. Tumor incidence was monitored by luciferase activity every 3 to 4 days and mice that lost the diagnostic pulmonary bioluminescence signal were regarded as tumor-free. Tumor-free (total influx of image photons < 16,000) survival rates (a, b) and overall survival rates are reported as Kaplan-Meier curves. Statistical analysis was performed by means of the Likelihood ratio test. Significances are expressed as *P < .05 and **P < .01 as compared to the PBS group (n = 8–11 mice per group).