
Figures & data
Table 1. Proportion of MC38 IC-implanted mice.
Figure 1. Two profiles of CRC development in immunocompetent B6 mice. a, b.
Bioluminescence emission monitoring (a) and image of one representative mouse per group (b) from progressive (Progr.) and rejecting (Rej.) CRC groups following IC-injection with 1 × 10⁶ MC38-fLuc cells. (Average ±SEM, n = 36 mice, representative experiment of 3). c: Ex vivo photograph (upper panel) and corresponding bioluminescent image (bottom panel) of representative caecums from day D8 and D32 MC38-fLuc IC-implanted mice. Arrows indicate tumors on the cecum. *P < 0.05, ****P < 0'.0001
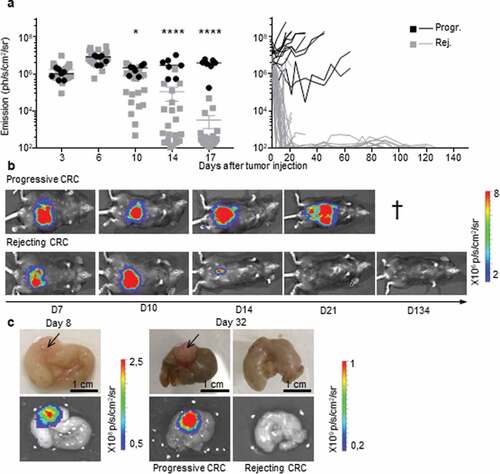
Figure 2. Rejection of MC38-fLuc tumors leads to elimination.
(a) Bioluminescent signals of 4 representative mice from the rejecting CRC group following IC-implantation of 1 × 10⁶ MC38-fLuc cells. Mice with * exhibit possible dormancy (n = 42% of rejecting CRC group, of the three independent experiments displayed in , n = 32 mice). (b) Bioluminescent images of a representative mouse (#2 from a) possibly exhibiting dormant tumor cells at various time points. Green arrows indicate the weak signal detected at day (D) 57 and 90. (c) Bioluminescence emission monitoring in mice from the CRC-rejecting group (following D0 IC injection of 1 × 10⁶ MC38-fLuc), depleted through injection (indicated by arrows) of anti(α)-CD4 antibody (Ab) (upper panel, n = 6 mice), α-CD8 Ab (middle panel, n = 6 mice) or control (Ctl, bottom panel, n = 5 mice). (d, e) Relative expression of RNA following RTPCR and qPCR (RNA, d) and amplification of genomic DNA following qPCR (DNA, e) in colons dissected from rejecting-CRC mice (Rej.) ex vivo n = 13 mice with n = 6 mice at D84 and n = 7 mice at D194 post-IC MC38-fLuc tumor implantation. Controls (ctl) are represented by in vitro tissue-culture MC38-fLuc (fLuc, positive ctl) and parental (par., negative ctl) cells, ex vivo naïve cecum (N., negative ctl) and D61 IC-tumor bearing mice from progressive-CRC group (Progr., positive ctl) (n = 2 to 4 mice). According to negative controls, values below 10–6 are considered background. The relative amplification was normalized to the amplification level of GAPDH.
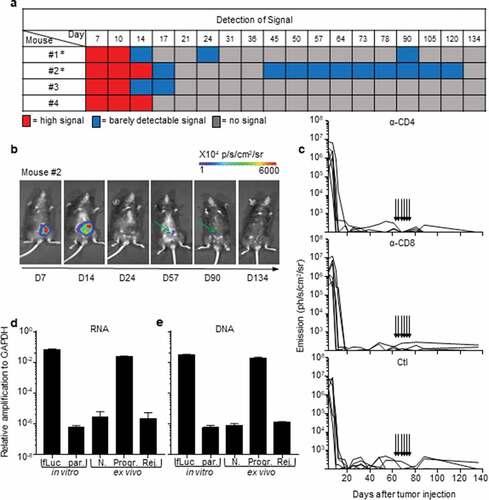
Figure 3. An immune-colon dependent effect generates the two CRC development profiles. a to c.
Mice were injected with MC38-fLuc cells in various location: intra-colon (IC) (a), intra-hepatic (IH) (b) and subcutaneously (SC) (c). Tumor growth monitoring through bioluminescence emission imaging (a, b) and caliper measurement (c) of 3 × 10⁶ IC-injected MC38-fLuc cells (n = 10 mice) (a) 2,5x10⁵ IH-injected MC38-fLuc cells (n = 6 mice) (b) and 3 × 10⁶ SC-injected MC38-fLuc cells (n = 9 mice). d, e: Bioluminescence emission imaging (Average±SEM) (d) and survival (e) of 1 × 10⁶ MC38-fLuc IC-injected in B6 mice (depicted only from progressive (B6 Progr.) CRC group, n = 10 mice), NOD/SCID mice (n = 10 mice) and nude mice (n = 16 mice). (d) Graph of bioluminescent emission (left panel, B6 only from Progr. group), representative photos of one mouse per group (middle panels, from B6 Progr. group, NOD/SCID, and nude) at day (D)3 and D9 and proportion of progressive (Progr.) and rejecting (Rej.) CRC B6, NOD/SCID or nude mice (right panels). *P < 0.05, **P < 0.005; ***P < 0.0005, ****P < 0.0001.
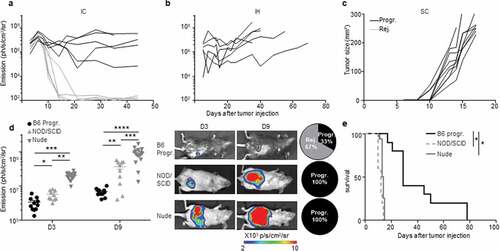
Figure 4. The immunosuppressive myeloid cell-related microenvironment is characterized in progressive CRC mice. a, b.
Bioluminescent emission measurement (a) and representative photo of one mouse per group used for FACS analyses (b) at day (D) 9, 20, and 29 following IC-implantation of 1 × 10⁶ MC38-fLuc cells at D0. (Average ±SEM, n = 6–7 mice, 2 pooled experiments). c to e: Quantitative data (upper panels) and D29 representative FACS dot plot analyses (lower panels) of progressive or rejecting tumors-infiltrating macrophages (Mϕ, gated as Gr1−, F4/80+, CD11b+) (c), dendritic cells (DCs, gated as Gr1−, CD11 c+, F4/80−) (d) myeloid-derived suppressor cells (MDSC, gated as Gr-1+, CD11b+) (e) at D9, 20, and 29. Each dot corresponds to a single mouse with a median from one representative experiment (Exp#1; n = 2–5 mice). Percentages are expressed on CD45.2+ live cells. *P < 0,05. Progr. = progressive CRC, Rej. = Rejecting CRC.
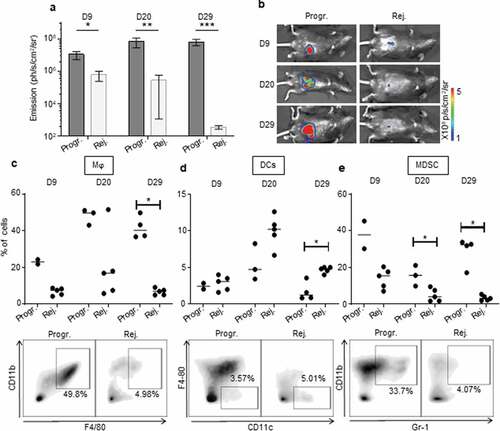
Figure 5. High CD8 T cells and low Treg infiltration in rejecting CRC tumors.
Quantitative data (upper panels) and D29 (a, b, c) or D20 (d, e, f) representative FACS dot plot analyses (lower panels) of tumor-infiltrating CD8+ T lymphocytes (CD8, gated as TCRβ+, CD8+) (a), CD4+ T lymphocytes (CD4, gated as TCRβ+, CD4+) (b), regulatory T lymphocytes (Treg, gated as TCRβ+, CD4+,CD25+, folate receptor (FR)4+) (c) as well as PD1 expression on CD8+ T lymphocytes (d), CD4+ T lymphocytes (e) and regulatory T lymphocytes (f) at 9, 20 and 29 days, as depicted, following IC-injection of 1 × 10⁶ MC38-fLuc cells. Each dot corresponds to a single mouse with a median from one representative experiment (Exp#1; n = 2–5 mice). Percentages of CD8+ and CD4+ T cells are expressed on CD45.2+ live cells and percentage of Treg are expressed on total CD4+ T cells. *P < 0,05. Progr. = progressive CRC, Rej. = Rejecting CRC.
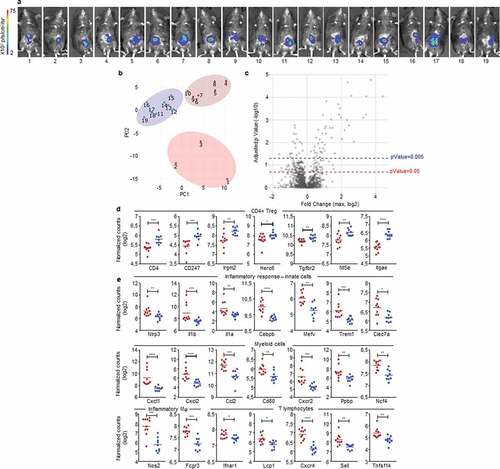
Figure 6. Early detection of opposing immune microenvironments in CRC tumors.
Nanostring analysis of CRC tumors harvested at day 3 after IC implantation of 1.106 MC38-fLuc cells in B6 mice (n = 19 mice). (a) Bioluminescent representative images at 2 days post-tumor implantation. (b) Principal component analysis (PCA) based on the Nanostring analysis results revealing three groups of mouse tumor samples. (c) The three group of mice (from PCA) were compared using ANOVA corrected multiple testing correction by the Benjamin-Hochberg (BH) methods and all fold change (FC) were calculated. Volcano plot showing the max FC computed for each gene and the corresponding adjusted p-Value. Blue-dotted line indicate threshold for adjusted p-Value = 0.2 (p-Value = 0.05) and red-dotted line indicates adjusted p-Value = 0.05 (p-Value = 0.005). (d, e) Dot plots representing the average and individual tumor expression of selected genes (normalized counts in log 2) analyzed by Nanostring technology. Dark-red and blue dots correspond to tumors belonging to the dark-red or blue groups, respectively, represented on heat maps from Supplementary Fig. S6. Selected genes highly expressed in (d) blue group (CD4+ Treg pattern) and (e) dark-red group of tumors (Inflammatory response-innate cells, myeloid cells, inflammatory macrophages (Mϕ) and T lymphocytes are depicted. *P < 0.05, **P < .005, ***P < .0005, ****P < 0.0001.
Supplemental material