Figures & data
Table 1. Clinical characteristics of patients among the different cohorts.
Figure 1. Unsupervised clustering analysis of the 93 ICP/MM gene expression signature for all 253 sarcoma samples. Heat map of the full signature for all samples. Sarcoma (in columns) are labeled by their histological subgroup. Genes belonging to the signature (in rows) are labeled by their biological relevance. (TNF: tumor necrosis factor, DR: death receptor, Cytotox: cytotoxic T cell, ICP: immune checkpoint, Mono: monocyte, Macro: macrophage, NK: natural killer and Neutro: neutrophil.).
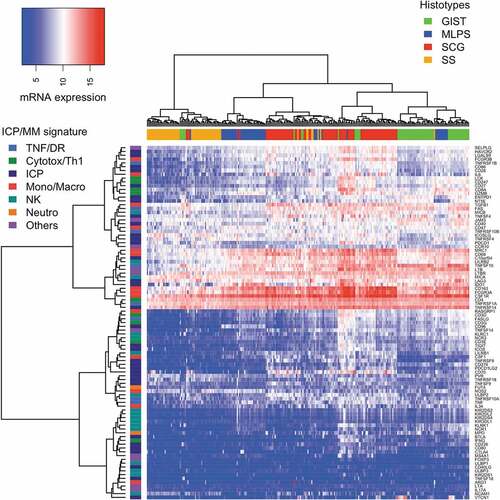
Figure 2. Correlation of ICP/MM genes expression with histological sarcoma subtype with t-SNE. t-SNE analysis processing a non-linear dimension reduction of the signature for all samples. Points are sarcomas highlighted in colors for each histological subtype (Dim: dimension).
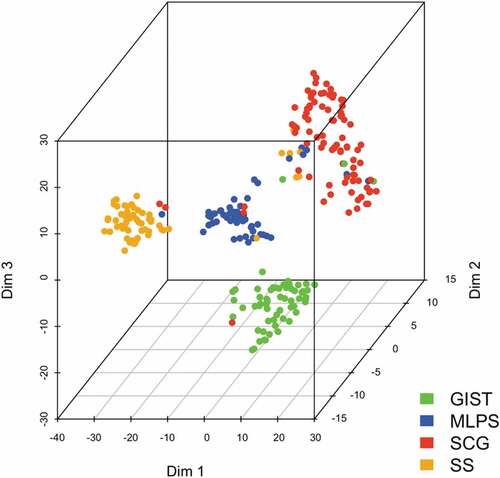
Figure 3. Expression level of the 93 ICP/MM genes across each sarcoma subtype.
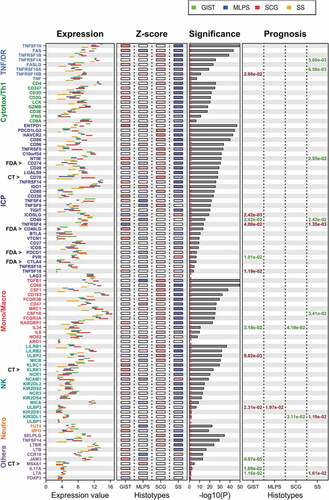
Figure 4. Immune population defined by CIBERSORT signature and their relevance across sarcoma subtypes.
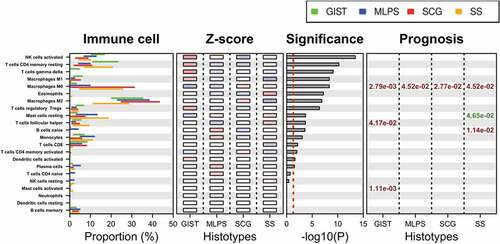
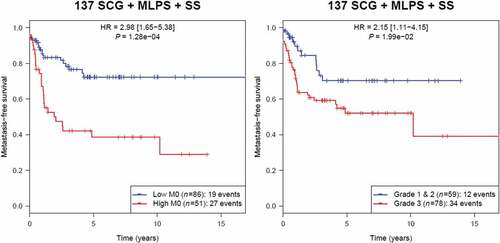
Figure 5. Kaplan-Meier analysis of metastasis-free survival according to M0-macrophage signature in the group of 137 sarcoma including SCG, MLPS and SS (unadjusted p).