1,350
Views
3
CrossRef citations to date
0
Altmetric
Brief Report

Tropomyosin autoantibodies associated with checkpoint inhibitor myositis

, &
Article: 1804703 | Received 15 Jun 2020, Accepted 28 Jul 2020, Published online: 12 Aug 2020

Figures & data

Figure 1. Comparison of IgA and IgG levels to tropomyosin isoforms 1, 2 and 3 in the reported clinical case study. IgA levels from the sera of a group of metastatic melanoma patients without myositis (n = 100) at baseline prior to undergoing immunotherapy are also illustrated. Levels are presented as Log2 fold changes (log2FC) and were calculated by dividing the case signal intensity for each antigen by the mean case signal intensity of all antigens or the median signal intensity of all antigens across the cohort of other metastatic melanoma samples. The horizontal line at log2FC = 3.47 represents the cutoff where the case Z score > 3, indicating a positive signal intensity.
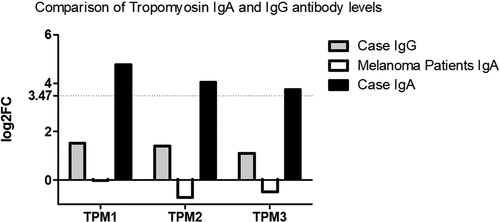
Figure 1. Comparison of IgA and IgG levels to tropomyosin isoforms 1, 2 and 3 in the reported clinical case study. IgA levels from the sera of a group of metastatic melanoma patients without myositis (n = 100) at baseline prior to undergoing immunotherapy are also illustrated. Levels are presented as Log2 fold changes (log2FC) and were calculated by dividing the case signal intensity for each antigen by the mean case signal intensity of all antigens or the median signal intensity of all antigens across the cohort of other metastatic melanoma samples. The horizontal line at log2FC = 3.47 represents the cutoff where the case Z score > 3, indicating a positive signal intensity.
Supplemental material

Supplemental Material

Download ()

Supplemental Material

Download ()