Figures & data
Table 1. Patient clinical parameters and their association with Siglec-15 expression.
Table 3. Univariate survival analysis of Siglec-15 expression in subgroups with different clinical parameters.
Figure 1. The transcription levels of Siglec-15 in human cancers.
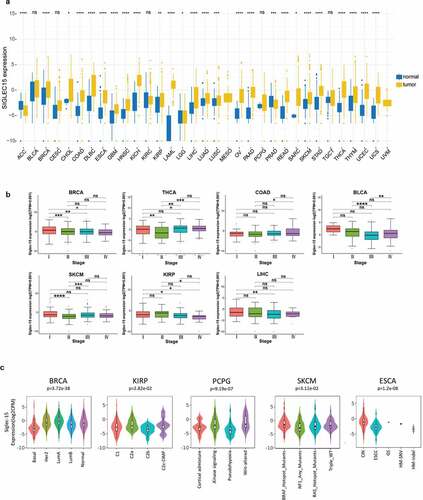
Figure 2. CNA and DNA methylation of Siglec-15 in human cancers.
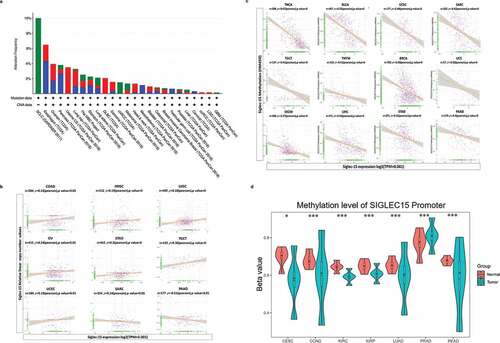
Figure 3. The prognostic significance of Siglec-15 assessed by Kaplan-Meier analysis.
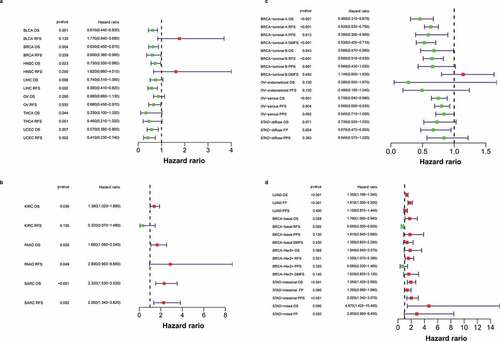
Figure 4. Correlation analysis between Siglec-15 expression and tumor-infiltrating immune cell.
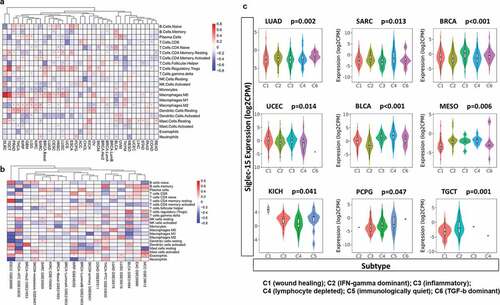
Figure 5. Significant pathways influenced by Siglec-15.
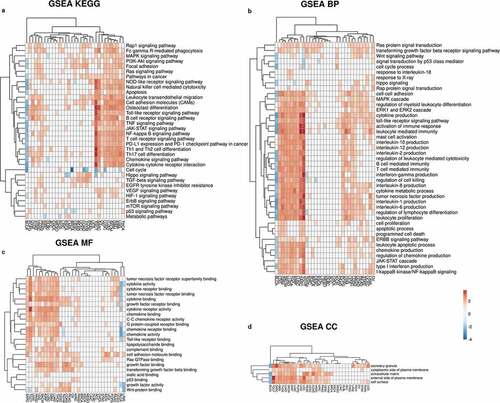
Figure 6. Preliminary experimental verification of Siglec-15 signature in LUAD.
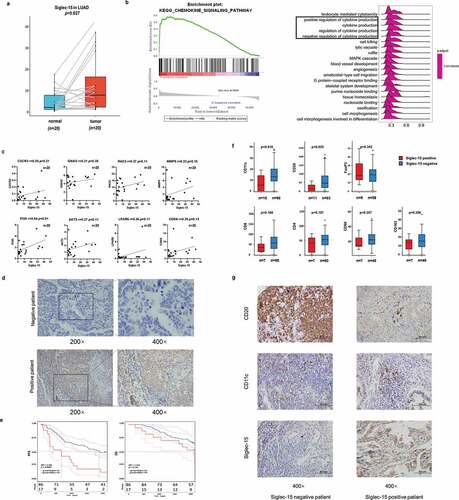
Table 2. Univariate survival analysis of clinical parameters and Siglec-15 expression with PFS and OS in patients with LUAD.
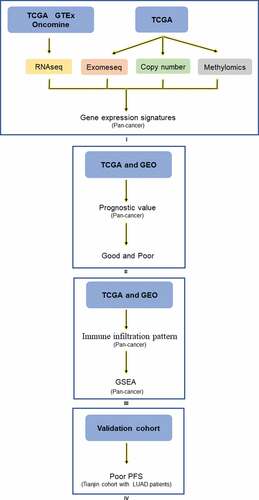
Figure 7. Analysis explanation with a detailed flow chart of this study. The study comprises 4 parts: Ⅰ Siglec-15 mRNA expression characteristics investigated by TCGA, GTEx, and Ocomine; Ⅱ Siglec-15 prognostic value landscape in TCGA and GEO; Щ Tumor infiltrating pattern and associated pathways about Siglec-15 in TCGA and GEO; Ⅳ Experiment verification in LUAD patients.