Figures & data
Figure 1. Natural history of COVID-19 infection, from incubation to critical disease.
Incubation phase is reported as variable between 0-14 days,Citation3,Citation5 then first clinical symptoms, upper respiratory tract infection (URTI) (rhinitis, anosmia and agueusia) and/or lower respiratory tract infection (LRTI)(cough, fever, thoracic pain and “happy hypoxia”) are observed. The second phase is characterised by persistent LRTI and leads to medical consultation and/or hospitalization. In the second phase of the disease, abnormal blood parameters involved in the severity of the disease can be observed. Then,from day 9 to 12 after the onset of symptoms (phase III), sudden deterioration caused by the cytokine storm syndrome and pulmonary (macro and micro) embolism can lead to acute respiratory distress syndrome (phase IV) and death. Therapeutic strategies have been proposed for each stage of the disease.Citation6 At the time of incubation, prophylaxis with hydroxychloroquine has showed mitigated results depending on the dosing.Citation7 In the first and second phase of the disease, hydroxychloroquine plus azithromycin and zinc showed promising resultsCitation6,Citation8,Citation9 Anticoagulant prophylaxis should be used from phase II to IV, since it was shown to reduce both, the cytokine storm and the risk of thrombotic complications.Citation10 Tocilizumab therapy may be useful in the third phase of the disease at the time of cytokine storm syndrome. Oxygen and intensive care therapy are used in the third and fourth phases of the disease.
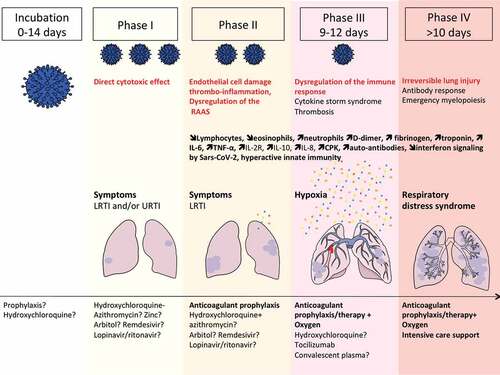
Figure 2. Extrapulmonary manifestations of COVID-19 identified in severe and critically ill patients (percentage in hospitalized patients).
Extrapulmonary manifestations are observed in one quarter to one third of hospitalized patients. Four mechanisms are involved in the pathophysiology of multiorgan injury: i. the direct viral toxicity, ii. Dysregulation of the renin-angiotensin-aldosterone system (RAAS). iii. Endothelial cell damage and thrombo-inflammation and iv. Dysregulation of the immune system and cytokine release syndrome that causes disseminated organ injuries. Histopathological analyses identified the virus in the lung, the kidney, the myocardium, the brain, and the gastro-intestinal tissues.Citation12-Citation18 The ACE2 and TMPRSS2 expression were confirmed by single cell RNA seq in epithelial cells of these organs.Citation16,Citation19. The entry of SARS-CoV-2 via ACE2 receptor in endothelial cells of arterial and venous capillaries generates the recruitment of innate immunosuppressive cells with pro-thrombotic features (“viral sepsis” like syndrome), favoring micro- and macro- thromboembolic events (stroke, infarction, myocarditis and pericarditis).
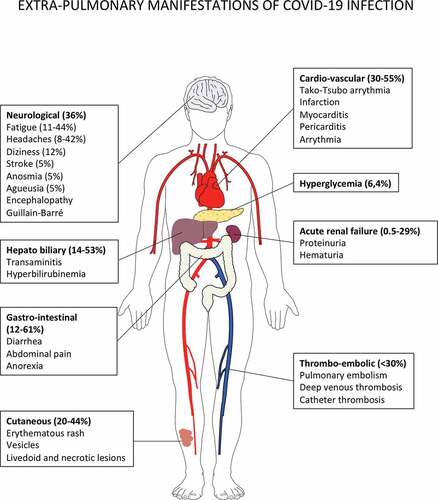
Figure 3. Putative immune scenarios associated with protective immune responses.
Bone marrow-derived monocytes and DC precursors migrate to lung and inflammatory lesions to cross-present apoptotic virally-infected epithelial cells. Indeed, cDC1 resist to viral infection and are expected to foster CD8+ Tc1 cell responses. Plasmacytoid DC may be readily infected by the SARS-CoV-2, becoming the first source of type 1 IFNs, and contributing to the chemo-attraction and the burst of monocyte derived macrophages in lesions. cDC2 could sense and become activated by mucosal commensals/opportunistic bacteria during COVID-19, thereby inducing additional signals through DNA and RNA sensing. The appropriate orchestration of MYD88 and TRIF signaling, and other PRR in these DC subsets could contribute to the efficient priming of effector Tc1 CD8 CTL, CD4+TFH for B cell maturation leading to the resolution of COVID-19 by the eradication of virally infected cells and acceleration of lung tissue repair. The balance between TFH and TH1 cells will depend on the recruitment of cells producing IL-6, IL-21, IL-12 and expressing CD40 and ICOSL, while sustained IFN signaling might favor chronicity of the inflammation and infection rather than the elicitation of B and T cell memory responses. Lung parenchyma ILC2, IL-10 producing CTLs, tolerogenic yolk sac derived-tissue resident interstitial macrophages might mitigate myeloid crisis allowing the elicitation of DC-dependent protective CTL responses. The bioactivity and success of concomitant antivirals and therapies dampening overt TLR signaling (such as JAK/STAT, IL-6R) will likely depend on the respective kinetics of viral replication and immune responses. It is unclear to which extent T cell exhaustion is relevant at the early phase of acute infection and whether immune checkpoint inhibitors (such as anti-CTLA4/PD-1/PDL-1) could resuscitate or mitigate T cell functions.
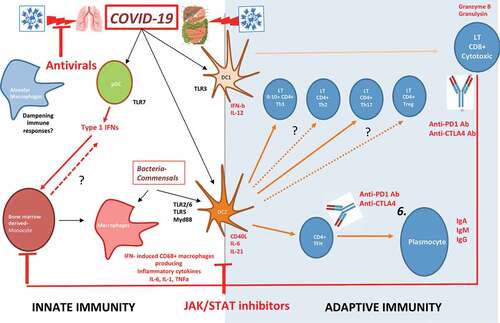
Figure 4. Bats are the natural reservoir of betacoronaviruses: immune specificities.
Bats are increasingly recognized as the natural reservoirs of viruses of public health concern.The SARS-CoV-2 that emerged from Wuhan shared 96% identity with a bat-borne coronavirus at the whole-genome level.Citation53 Bats primary immune cells exhibit dampened activation of the NLRP3 inflammasome compared to human or mouse counterparts, related to a novel splice variant and an altered leucine-rich repeat domain of bat NLRP3.Citation54 Lower secretion of interleukin-1β in response to both ‘sterile’ stimuli and infection with multiple zoonotic viruses was observed with no impact on the overall viral loads. The study of the immune organs from wild-caught bats revealed a predominance of CD8+ T cells in the spleen, reflecting either the presence of viruses in this organ or the steady state. The majority of T cells in circulation, lymph nodes and bone marrow (BM) were CD4+ subsets. 40% of spleen T cells expressed constitutively IL-17, IL-22 and TGF-β mRNA. Furthermore, the unexpected high number of T cells in bats BM could suggest a role for this primary lymphoid organ in T celldevelopment.Citation55
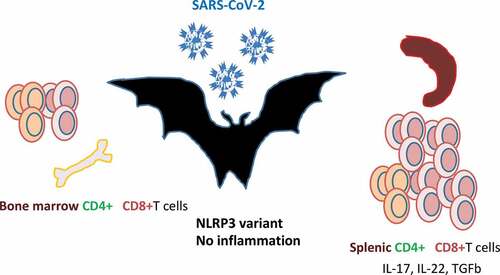
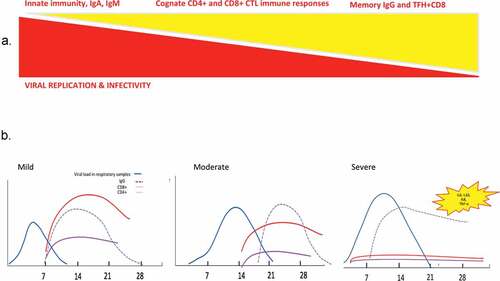
Figure 5. Race between viral replication and immune responses during viral infection with SARS-CoV viruses.
Theoretical principles (A) and tentative scheme (B) of the kinetics of virus replication and infectivity, humoral and cellular immune responses, based on previous human pandemic infections with betacoronaviruses.