Figures & data
Figure 1. slanMo and NK cells infiltrate human melanoma. (A) slanMo (slan – green) and NK cells (CD56 – red) were analyzed in FFPE samples of melanoma patients from stage I, stage II, stage III cutaneous lesions (III cutan.), stage III Lymphnode (III LN) metastasis, stage IV distant metastasis, and healthy skin (hSkin) (n = 7). Based on 3 images (200x magnification) of double-stained (slan + CD56) samples, the density of cells/mm2 was analyzed and densities of slanMo were correlated with CD56+ NK cells. Density of (B) slanMo (slan) and (C) CD56+ NK cells displayed as cells/mm2 over all stages of melanoma development and in healthy skin. Number of patients for stage I (n = 10), stage II (n = 16), stage III (n = 10), stage III LN (n = 10), stage IV (n = 8), and healthy skin (n = 7). Original magnification x100 (left column), x200 (middle column), x630 (right column).
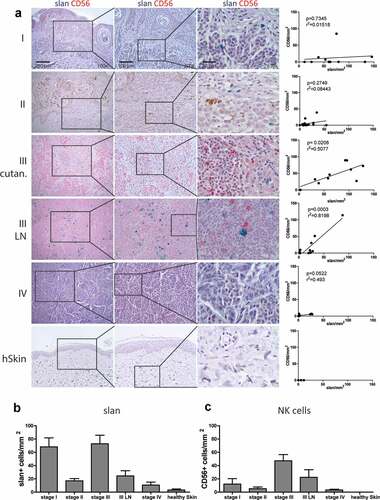
Figure 2. slanMo induce specific NK cell migration via IL-8 production. (A) slanMo were cultured for 24 h and cell-free supernatants were analyzed regarding chemokine production. Cells were either treated with 1 µg/ml R848 6 h after seeding or left untreated. For each condition, five different healthy donors are displayed. (B) Concentrations of CCL3, CCL4, and IL-8 as determined in the chemokine screen. (C) NK cells were used in a migration assay with 5 µm pore size with R848-stimulated slanMo supernatant (slan conditioned medium (slanMo CM)) in the presence of an anti-IL-8 neutralizing antibody or respective isotype control. Migrated NK cells were quantified by measuring ATP levels in the bottom chamber after 2 h. Cumulative data from 6 donors. (D) Experimental set-up for transwell experiment analyzing receptor expression on migrated NK cells. Migrated NK cells were analyzed for CXCR1 and CXCR2 expression by flow cytometry. Representative data out of five donors. (E) Mean fluorescence intensity values for receptor expression of CXCR1 and CXCR2 as shown in (D).
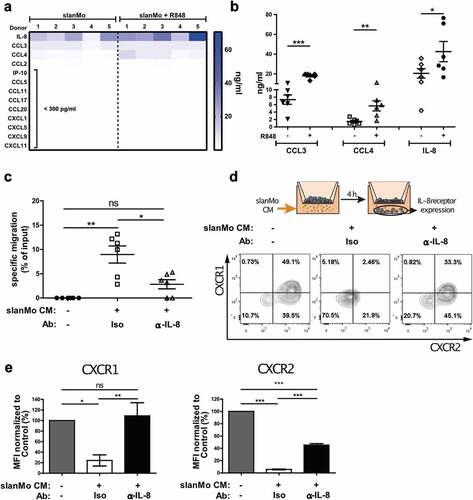
Figure 3. The conditioned medium (CM) from slanMo and NK cell co-cultures leads to a growth arrest in melanoma cells. (A) Growth curve of SK-Mel-28 untreated (Control medium), or treated with R848-activated slanMo/NK cell co-culture conditioned medium (CM), R848-activated slanMo-conditioned medium (slanMo CM), or R848-activated NK cell-conditioned medium (NK cell CM). The melanoma cells were incubated for 3–4 d with the respective CM. After CM treatment, the cells were washed and cultured in normal control medium. Cumulative data from 2 (CM) or 3 donors (slanMo CM and NK cell CM). (B) Cytokine screen of conditioned medium from different cultures either unstimulated or stimulated for 18 hours with 1 µg/ml R848 or 100 ng/ml LPS. (C) Growth curve of SK-Mel-28 and Ma-Mel-86b after treatment with recombinant TNF-α and IFN-γ (10 ng/ml and 100 ng/ml, respectively). (D) Growth curve of SK-Mel-28 after incubation with co-culture CM with neutralizing antibodies against TNF-α/IFN-γ (α-TNF-α/IFN-γ) or respective isotype controls (Iso) (each 10 µg/ml). Cumulative data from 12 donors.
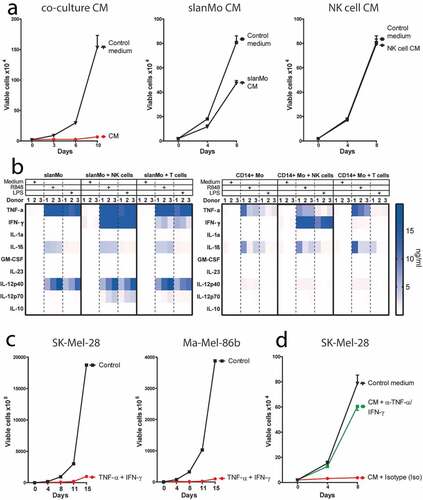
Figure 4. The co-culture conditioned medium (CM) from slanMo and NK cells reduces the proliferation of melanoma cells. (A) Ki67 staining of SK-Mel-28 cultured with CM as described before. Quantification of Ki67+ cells. Representative image and cumulative data out of 11 donors. (B) Ki67 staining of SK-Mel-28 treated with recombinant TNF-α and IFN-γ and quantification of positive cells. Representative image out of 3 experiments. (C) 3H-Thymidine incorporation assay with SK-Mel-28 cells treated with CM as described before. 1 d after reseeding, the cells were pulsed with 3H-Thymidine for 12 h. Cumulative data out of 14 donors. (D) 3H-Thymidine incorporation assay with SK-Mel-28 cells treated with recombinant TNF-α and IFN-γ. Cumulative data from 4 experiments.
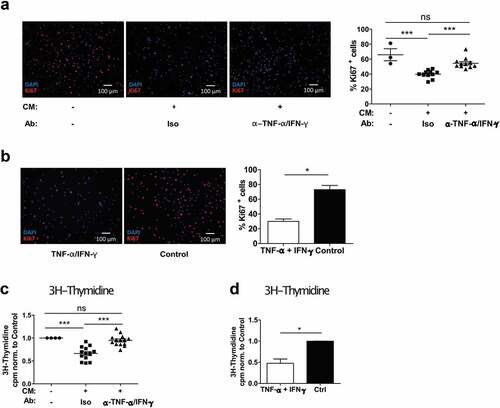
Figure 5. The slanMo/NK cell cross-talk induces melanoma cell senescence characterized by p21 upregulation. (A) SK-Mel-28 were treated with co-culture CM, as described before. After 4 d incubation, the cells were reseeded and stained for senescence-associated β-Galactosidase (SA β-Gal) activity. Depicted is a representative image and quantification of positive cells includes cumulative data from 14 donors. (B) SK-Mel-28 were treated with TNF-α and IFN-γ and stained for SA β-Gal and quantified. Cumulative data from 3 experiments. (C) Western Blot for p21 of SK-Mel-28 cells treated as described before with conditioned medium (CM) with TNF-α and IFN-γ neutralization (each 10 µg/ml) or respective isotype controls (Iso). Quantification of p21 signal intensity. Representative image and cumulative data from 13 donors. (D) Western Blot of p21 expression in SK-Mel-28, Ma-Mel-86b, SK-Mel-25, and SK-Mel-30 untreated or treated with recombinant TNF-α/IFN-γ (10 ng/ml/100 ng/ml) for 4 d. Representative images out of 2 experiments. (E) SK-Mel-28 were treated as described before, reseeded and analyzed for p21 in Immunofluorescence. Quantification of p21 positive cells. Cumulative data out of 14 donors. (F) SK-Mel-28 were treated with TNF-α and IFN-γ and stained for p21 by Immunofluorescence and quantified. Representative image out of 3 experiments.
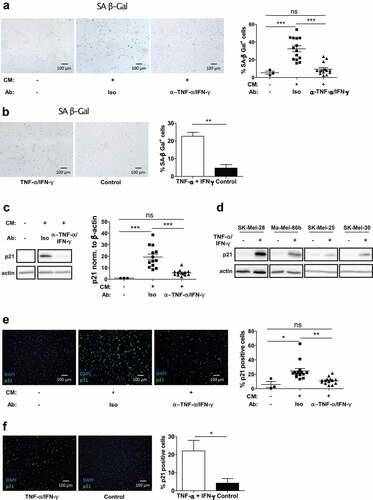
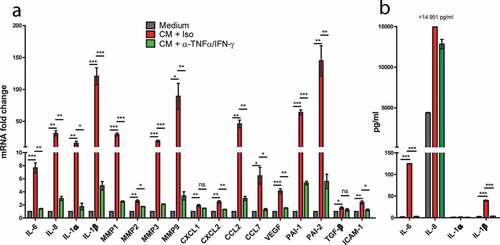
Figure 6. Senescence-associated secretory phenotype (SASP) induction in response to slanMo/NK cell co-culture CM. (A) SK-Mel-28 cells were treated as described before with co-culture conditioned medium (CM) and TNF-α and IFN-γ neutralization (α-TNF-α/IFN-γ). A panel of SASP-associated markers was analyzed by qPCR. Cumulative data from 3 biological replicates. (B) The cell-free-conditioned medium from SK-Mel-28 cells reseeded after treatment with slanMo/NK cell CM was analyzed for several soluble factors by Legendplex analysis. Cumulative data from three biological replicates. Data are presented as mean ±SEM and p values were assessed using unpaired t-test with *p < .05, **p < .01, ***p < .001.