Figures & data
Figure 1. β-Catenin inhibition induces lymphocyte infiltration in CT26 tumors. Mice bearing CT26 tumors were treated with iCRT14 or vehicle every other day for 12 d. FACS was performed to analyze tumor-infiltrating immune cells. (a) Percentage of CD45+ cells in total live cells. (b) Percentage of CD8+ T cells (CD45+CD3+CD8+) in CD45+ cells. (c) Percentage of conventional CD4+ T cells (CD45+CD3+CD4+Foxp3−) in CD45+ cells. (d) Percentage of NK cells (CD45+NKp46+CD3−) in CD45+ cells and total live cells. (e) Percentage of Treg cells (CD45+CD3+CD4+CD25+Foxp3+) in CD45+ cells. (f) Ratios of CD8+ T to Treg cells, and conventional CD4+ T to Treg cells. (g) Percentages of macrophages (MΦ) (M1: CD45+CD11b+F4/80+ CD206lowMHC-IIhigh; M2: CD45+CD11b+F4/80+CD206highMHC-IIlow) and MDSCs (CD45+CD11b+Gr-1+CD11c−MHC-II−/low) in total live cells. (h) Percentages of Ki67+ cells in CD8+ T, conventional CD4+ T, NK and Treg cells. (i) Percentages of Granzyme B+ (Gzmb+) and IFN-γ+ cells in CD8+ T and NK cells. * P < .05, n.s. = not significant
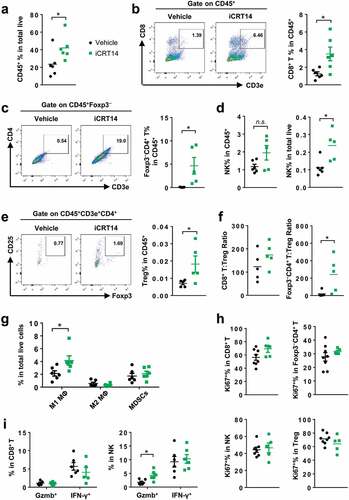
Figure 2. β-Catenin blockade induces lymphocyte infiltration in MC38-S33Y.β-cat tumors. Mice bearing MC38-S33Y.β-cat tumors were treated with iCRT14 or vehicle every other day for 12 d. Immunofluorescence was performed to analyze tumor-infiltrating CD4+ T (by CD4 staining) (a), CD8+ T (by CD8 staining) (b), and NK cells (by NKp46 staining) (c). Total cell number was counted by nucleus staining (DAPI). Scale bar = 100 µm. ** P < .01, *** P < .001
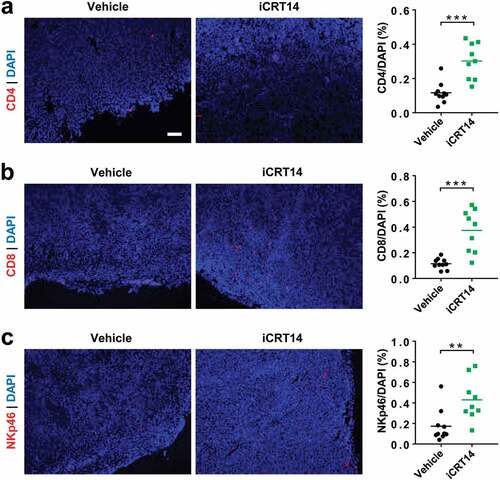
Figure 3. β-Catenin inhibition upregulates the expression of CXCR3 chemokines in colorectal tumor cells. (a) qPCR analysis of chemokine mRNA expression in CT26 tumors of iCRT4- or vehicle-treated mice. n = 4. (b) qPCR analysis of chemokine mRNA expression in CT26 cells treated with iCRT14 or vehicle in vitro. n = 4. (c) Quantification of CXCL10 proteins in the media of CT26 cell culture by ELISA. n = 3. (d-e) CT26 (d) or MC38 (e) were transduced with lentivirus containing S33Y.β-catenin or empty vector. Expression of β-catenin protein and chemokine mRNA expression was measured by Western blot and qPCR respectively. n = 4. (f) MC38-S33Y.β-cat cells was treated with iCRT14 or vehicle. Chemokine mRNA expression was analyzed by qPCR. n = 4. (g) qPCR analysis of chemokine mRNA expression in HCT16 and SW480 cell lines treated with iCRT14 or vehicle in vitro. n = 4. * P < .05, ** P < .01, *** P < .001, **** P < .0001
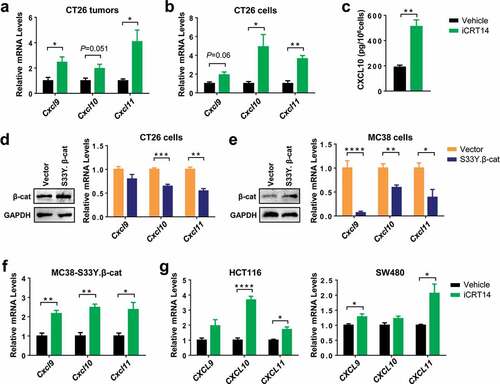
Figure 4. iCRT14 synergizes with vaccine therapy for tumor control. (a) Scheme of tumor vaccine and iCRT14 treatments. (b) Tumor growth of CT26-OVA tumors upon tumor vaccine, iCRT14 or combination treatments. n = 5/group. **** P < .0001
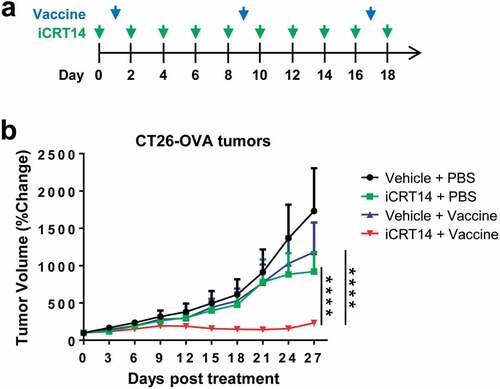
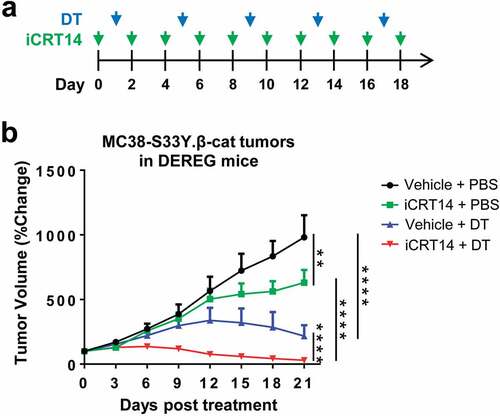
Figure 5. iCRT14 synergizes with Treg cell ablation to eradicate colorectal tumors. (a) Scheme of DT and iCRT14 treatments. (b) Tumor growth of MC38-S33Y.β-cat tumors in DEREG mice upon tumor vaccine, iCRT14 or combination treatments. n = 6/group. ** P < .01, **** P < .0001