Figures & data
Figure 1. Construction of TT1-E7E6. Schematic view of (a) a LCMV wt particle (left) and its genome (right). The ambisense RNA genome encodes 4 viral proteins: GP (glycoprotein), NP (nucleoprotein), L (RNA-directed RNA polymerase) and Z (RING finger protein Z). (b) The engineered TT1-E7E6 vectors contain artificially duplicated S-segments, encoding either GP or NP but not both, and a fusion protein of HPV16 E7E6, with 5 implemented amino acid mutations as indicated by the asterisks (*), as well as the L-segment.
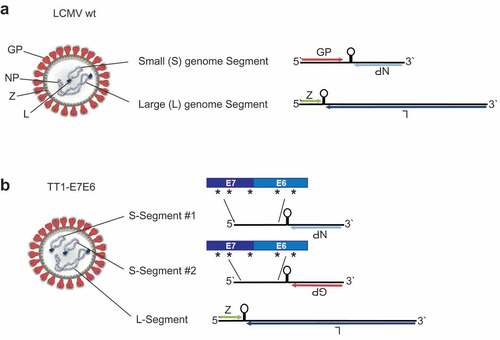
Figure 2. TT1-E7E6 exhibits reduced in vivo replicative capacity and neurovirulence. (a) Immunocompetent mice were i.v. infected with 2 × 10⁶ RCV FFU of TT1-E7E6 or the corresponding LCMV wt. Viral loads in the blood were measured by immunofocus assay on Day 4, 8, 11, 15 and 20 post-administration. Data shown are means ± SD. The dotted line indicates the limit of quantification (LOQ, log10 2.3 RCV FFU). N=5 mice per group. (b) Survival curve of mice inoculated intracranially (i.c.) with TT1-E7E6 or LCMV wt. A tail-spin test was performed on all surviving animals for detection of choriomeningitis, which was defined as the humane endpoint for survival analysis. N=6 mice per group. Mantel-Cox test. Ns, not significant, * p<.05, ** p<.01, *** p<.001.
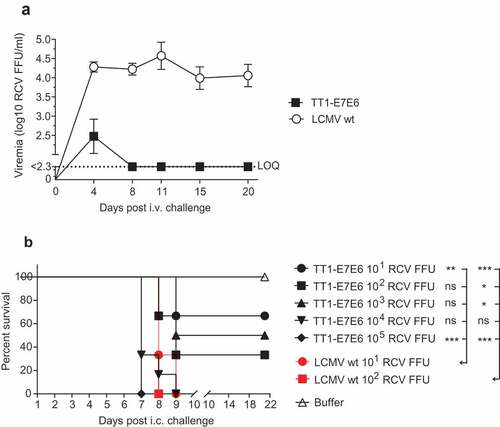
Figure 3. TT1-E7E6 is highly immunogenic and mediates potent antitumor activity. (a) HPV16 E7 responses after immunization. Mice were immunized i.v. with increasing doses of TT1-E7E6 or buffer control on Day 0 and 21. HPV16 E7-specific CD8 (CD8+B220−) T cell frequencies were determined in the blood on Day 9 (prime) and Day 30 (boost). Each dot represents one animal. Shown are means ± SEM. N=8 mice per treatment group; n=4 mice per buffer group. Statistical analysis by unpaired Welch`s t-test. (b) Kinetics study of immunogenicity. Mice were immunized i.v. with 105 RCV FFU of TT1-E7E6 or buffer control on Day 0 and 21. HPV16 E7-specific CD8+ (CD8+B220−) T cell frequencies were determined in the blood up to 42 days. Pooled data from 6 mice per group are shown. (c) Polyfunctional CD8+ T cell responses in immunized mice. Mice were immunized i.v. with 105 RCV FFU of TT1-E7E6. Non-vaccinated naïve mice were used as controls. Frequencies of splenic CD8 T cells producing different combinations of IFN-γ, TNF-α and IL-2 in response to E7 or E6 peptide re-stimulation were determined on Day 9 post-immunization as indicated in the chart. Only cytokine combinations exceeding 0.1% on average are shown. The right-hand bar (Total cyt+) depicts the combined frequency of the three populations of cytokine-secreting cells as depicted on the left. Symbols represent individual mice. N=5 per TT1-E7E6 group, n=3 per no vaccine control group. Bars show means ± SD. Mann Whitney test, ns, not significant, * p<.05. (d) Antitumor efficacy by TT1-E7E6 immunization. Mice were inoculated with 105 TC-1 cells on Day −5. On Day 0 upon appearance of palpable tumors, mice were randomized and immunized i.v. with increasing doses of TT1-E7E6 (prime) or buffer followed by a boost injection on Day 14, as indicated by the syringe symbols. Means ± SEM. N=12 mice per group. Two-way ANOVA was performed for statistical analysis. ns: 102 vs. 103, 104 vs. 105 and 105 vs. 106. p<.01: 104 vs. 106. p<.0001: 102/103 vs. 104/105/106. In the figure, **** p<.0001. (e) Kaplan-Meier survival curves of TC-1 tumor-bearing mice receiving TT1-E7E6 treatment. Mantel-Cox test. ns, not significant, * p<.05, ** p<.01, *** p<.001, **** p<.0001.
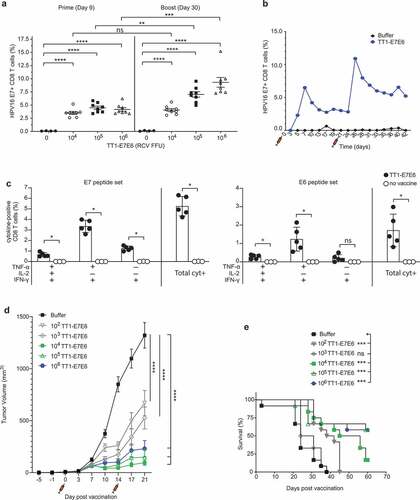
Figure 4. Combination therapy with TT1-E7E6 and PD-1 checkpoint inhibitor eliminates tumors. (a) Schematic design of experiment. All mice were inoculated s.c. with 105 TC-1 tumor cells on Day −5. After tumors became measurable, mice were randomized and treated with 106 RCV FFU of TT1-E7E6 or buffer On Day 0, 21 and 42. Anti-PD-1 antibody (αPD1) or isotype control (IgG ctrl) was administered i.p at a dose of 200 µg/mouse on the same days of TT1-E7E6/buffer treatment, followed by 3 additional doses every 3 days. Tumor growth was monitored. The study was terminated 73 days after start of treatment. (b) Kinetics of tumor growth in individual mice. Numbers in parentheses indicate number of mice with tumor regression/total number of mice in each group. (c) Kaplan-Meier curves showing percentage of TC-1 tumor-bearing mice. Buffer/IgG control, n=6 mice; TT1-E7E6/IgG, n=10 mice; buffer/anti-PD-1, n=10 mice; TT1-E7E6/anti-PD-1, n=9 mice. Mantel-Cox test. ns, not significant, * p<.05, *** p<.001. (d) HPV16 E7-specific CD8+ T cells in tumor-bearing mice were measured 9 days after individual treatment time point (prime, boost and 2nd boost). Means ± SEM. Unpaired Welch`s t-test. * p<.05, ** p<.01, *** p<.001.
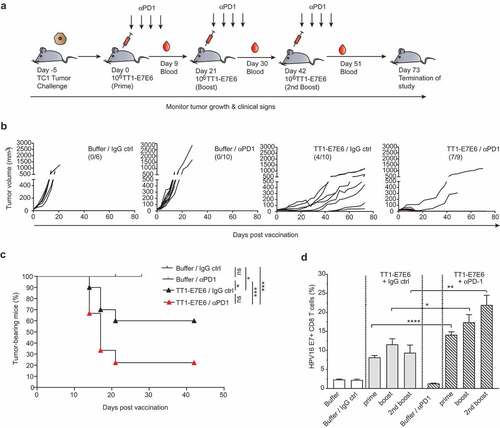
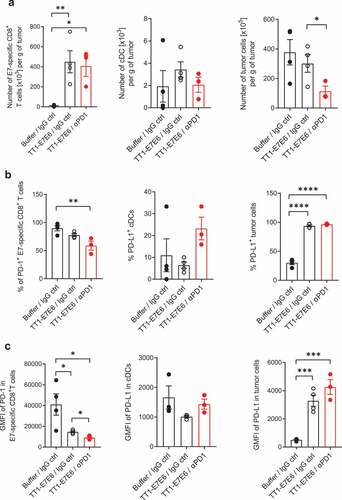
Figure 5. Analysis of tumor-infiltrating immune cells in tumor-bearing mice treated with TT1-E7E6 alone or in combination with anti-PD-1. TC-1 tumor-bearing mice were treated with TT1-E7E6 (1x10⁶ RCV FFU i.v.) on Day 9, with or without anti-PD-1 (clone 29F.1A12, 200 µg/dose i.p.) on Day 9, 12 and 15 after tumor cell implantation. Tumors were extracted on Day 16 and analyzed by flow cytometry. (a) Absolute numbers of HPV16 E7-specific CD8+ T cells (live, CD45+B220−NKp46−CD11b−CD3+CD8+E7+), conventional dendritic cells (cDC) (live, CD45+CD64−F4/80−Lin−I-A/I-E+CD11c+CD26+) and tumor cells (live, CD45−) per gram (g) of tumor tissue. (b) Percentage of PD-1+ E7-specific CD8+ T cells, PD-L1+ cDCs and PD-L1+ tumor cells. (c) Expression of PD-1 (stained with clone RMP1-30) on E7-specific CD8+ T cells and of PD-L1 on cDCs and tumor cells. Geometric mean fluorescence intensity (GMFI). N=4 mice per group for buffer control and TT1-E7E6 groups, N=3 mice for TT1-E7E6/anti-PD1 group. Means ± SEM. One-way ANOVA to compare treatment to buffer groups and unpaired Welch`s t-test to compare both treatment groups. * p<.05, ** p<.01, *** p<.001, **** p<.0001.