Figures & data
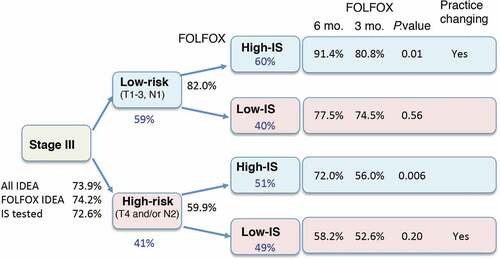
Figure 1. Treatment decision-tree using low pathological risk (T1-3, N1) high pathological risk (T4 and/or N2) categories, and the consensus Immunoscore (IS) with pre-defined categories (high >70%, and low <70%). The 3 years DFS rates (%) (black), and proportion of patients (%) (blue) are illustrated. The predictive value of Immunoscore is calculated comparing 3 to 6 months FOLFOX treatment using Log rank statistical test.