Figures & data
Figure 1. The design of this study. ESCC: esophageal squamous cell carcinoma; NC: normal control; ELISA: enzyme-linked immunosorbent assay.
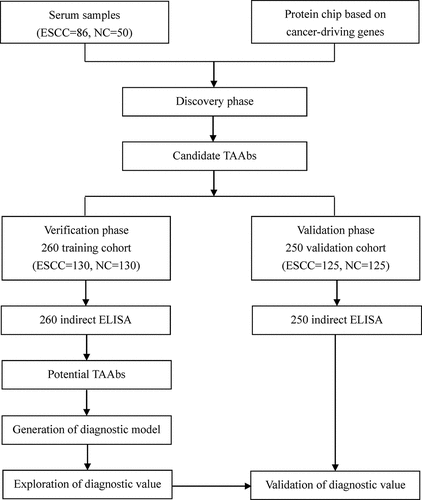
Table 1. Clinical characteristics of ESCC patients and controls in verification and validation phase.
Table 2. Diagnostic value of 12 anti-TAAs autoantibodies in training and validation cohort for ESCC detection.
Figure 2. The expression levels of 12 anti-TAAs autoantibodies in ESCC patients and healthy controls. (a) Scatter plots of the expression levels of autoantibodies in training cohort, (b) scatter plots of the expression levels of autoantibodies in validation cohort. Lines represented median and quartile range; E, ESCC patients; N normal controls.
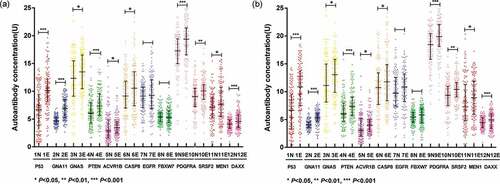
Figure 3. Diagnostic performance of 12 anti-TAAs in training cohort for ESCC detection.
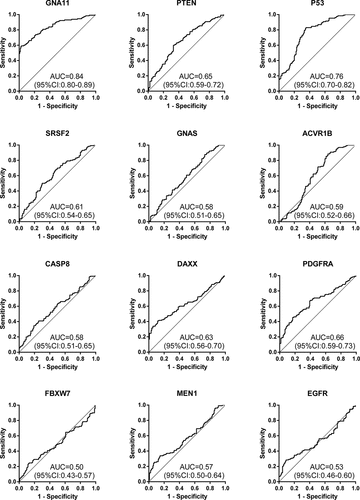
Figure 4. Diagnostic performance of 12 anti-TAAs in validation cohort for ESCC detection.
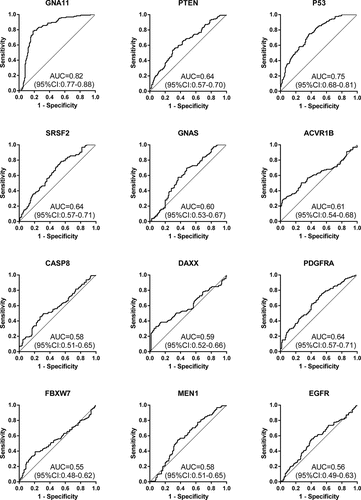
Table 3. Diagnostic value of the anti-TAAs autoantibodies panel for ESCC patients with different stages.
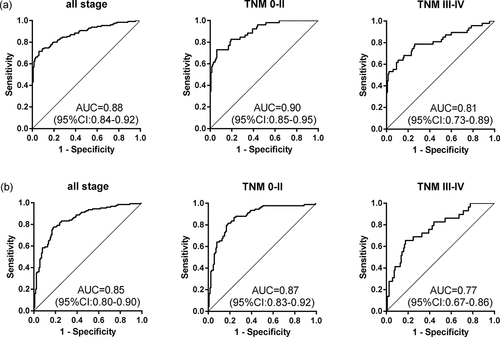
Figure 5. The value of the model for detecting ESCC with different stages in two cohorts. (a) The prediction model for ESCC detection in training cohort. (b) The prediction model for ESCC detection in validation cohort.