Figures & data
Figure 1. Immunocombination therapy using anti-GD2 mAb and Vorinostat dramatically reduces intra-adrenal neuroblastoma tumor weight. (a) Diagram shows the treatment schedule for immunocombination therapy using anti-GD2 mAb and Vorinostat. Mice were inoculated intra-adrenally with 1 × 10⁶ 9464D-luc cells on day 0. Anti-GD2 mAb therapy (200 μg per injection, i.p.) was initiated on day 3 and repeated two times per week. Vorinostat therapy (150 mg/kg) was initiated on day 7 and given for 3 consecutive days and this scheme was repeated weekly for four weeks. Tumor growth was monitored using bioluminescent imaging. (b) Left; picture of tumors that were excised at day 37. Right; tumor weight was recorded from the excised tumors at day 37 or when mice were sacrificed earlier (Isotype n = 5, anti-GD2 mAb n = 6, Vorinostat n = 6, anti-GD2 mAb + Vorinostat n = 6).
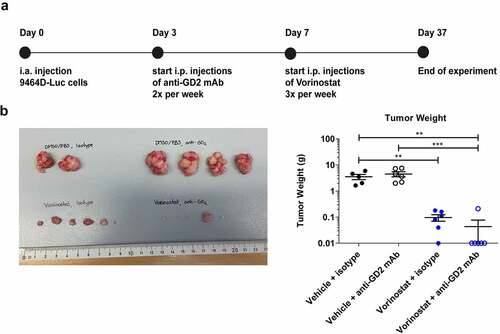
Figure 2. Vorinostat treated tumors are highly infiltrated with leukocytes, expressing high levels of MHCII and Fc-receptors. Mice bearing intra-adrenal 9464D tumors were treated with isotype, anti-GD2 mAb or Vorinostat according to schedule of . At day 37 tumors were excised and single-cell suspension were made of available tumors. (a-f) Bar graphs show mean percentages ± SD of tumor-infiltrating CD45.2+ immune cells (a), CD11b+ myeloid cells (b), F4/80high macrophages (c), CD11chighMHCIIhigh dendritic cells (d), Ly6ChighLy6Gneg monocytes (e) and Ly6CdimLy6Ghigh granulocytes (f). (g) Bar graphs show mean fluorescent intensity (MFI) ± SD of MHCII on Ly6GnegLy6Chigh monocytes. (h) Bar graphs show mean percentages ± SD of tumor-infiltrating CD8+ T cells, CD4+ T cells and CD25+FoxP3+ regulatory T cells. (i-k) Bar graphs show MFI ± SD with representative histogram of MHCII (i), FcRγI (j) and FcRγII/III (k) on CD11b+ myeloid cells. (l) Bar graphs show mean MFI ± SD of GD2 on single cells. (Isotype n = 2, anti-GD2 mAb n = 4, Vorinostat n = 3–4).
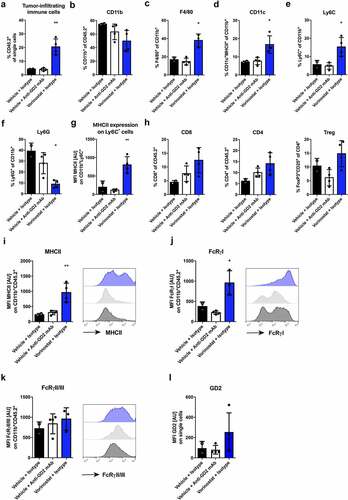
Figure 3. Immunohistochemical detection of CD45.2, F4/80, MHCII, FcRγI and FcRγII/III positive cells in neuroblastoma tumor sections. Mice bearing intra-adrenal 9464D tumors were treated with isotype, anti-GD2 mAb or Vorinostat according to schedule of . At day 37 tumors were excised and available tumors were snap frozen. Immunohistochemistry staining for CD45.2 (a), F4/80 (b), MHCII (c), FcRγI (d) and FcRγII/III (e) in two representative isotype control and Vorinostat treated mice.
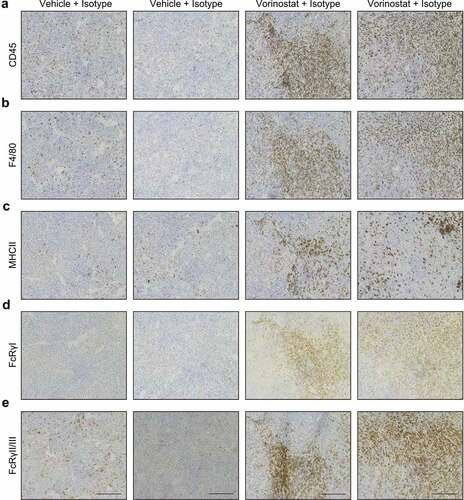
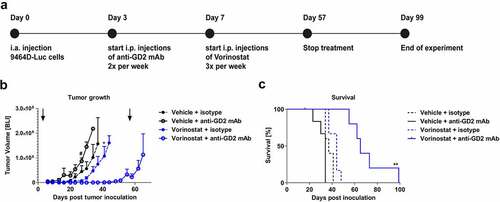
Figure 4. Combined treatment with anti-GD2 mAbs and Vorinostat increases survival of intra-adrenal tumor-bearing C57Bl/6 albino mice. (a) Diagram shows the treatment schedule for immunocombination therapy using anti-GD2 mAb and Vorinostat. C57Bl/6 albino mice were inoculated intra-adrenally with 1 × 10⁶ 9464D-luc cells on day 0. Anti-GD2 mAb therapy was initiated on day 3 and repeated two times per week. Vorinostat therapy was initiated on day 7 and given for 3 consecutive days and this scheme was repeated weekly for eight weeks (until day 57), where after treatment was stopped. Tumor growth was monitored using bioluminescent imaging. (b) Intra-adrenal neuroblastoma tumor growth was monitored twice weekly using bioluminescence. Quantification of the bioluminescent count represents tumor growth. Arrows indicate start and end of treatment regimen. Mean tumor volumes of each treatment group are depicted (# p < .05 for anti-GD2 vs. Vorinostat + anti-GD2 mAb) (* p < .05 for Vorinostat vs. Vorinostat + anti-GD2 mAb). (c) Kaplan-meier curves show survival percentages of mice inoculated intra-adrenally with 9464D-luc cells receiving isotype, anti-GD2 mAb, Vorinostat or anti-GD2 mAb + Vorinostat treatment (n = 6 per group, one mouse in the isotype group was excluded from the analysis due to a water kidney).