
Figures & data
Figure 1. Identification of four B-cell epitope sequences of human PD-1. (a) Amino acid sequences of human PD-1, peptides 32–50, 45–64, 73–90 and 92–110 were chosen for evaluation. (b) The secondary structure of the sequences of human PD-1 epitopes as modeled by PyMOL. (c) The structure of the PD-1/PD-L1 complex as adapted by Zak et al.,Citation34 key amino acids involved in the interaction between hPD-1 (light blue ribbon model; navy blue amino acid residues) and hPD-L1 (green ribbon model; light green amino acid residues) are illustrated. Amino acids that constitute the central hydrophobic core of the hPD‐1/hPD-L1 interface are indicated in yellow. Strands on both PD-1 and PD-L1 are indicated by red letters; (d) The 3D structure of human PD-1(92–110) peptide epitope as illustrated by PyMOL. (e): Immunogenicity and antigenicity of MVF-PD-1 B-cell epitopes. New Zealand white rabbits were immunized with 1 mg of each MVF-peptide immunogens dissolved in dd H2O emulsified (1:1) in Montanide ISA 720 vehicle (Seppic) with 333 μg of N-acetylglucosamine-3yl-acetyl-l-alanyl-d-isoglutamine (nor-MDP). Rabbits were boosted with the same doses at 3-week intervals. Blood was collected via the central auricular artery in rabbits. Sera (terminal) from rabbit (3Y+3) immunized with MVF-PD-1 peptide immunogens were tested individually versus the immunogen, acetylated B-cell epitope, the free B-cell epitope and the rhPD-1 protein by ELISA. 200 ng/well peptide or 500 ng/well of rhPD-1protein were used in duplicates to coat the ELISA plates. Titers are defined as the highest dilution of sera with an absorbance value of 0.2 after subtracting the blank
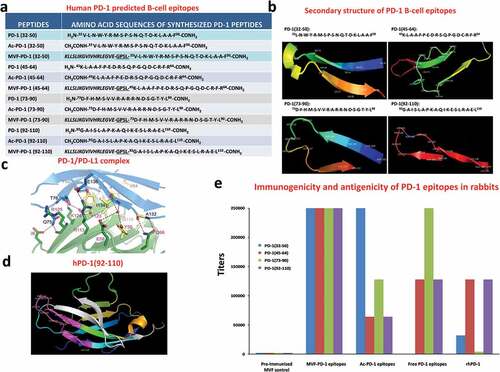
Figure 2. Characterization of novel hPD-1 peptide epitopes by SPR. The specificity of PD-1 was determined by SPR spectroscopy (Biacore T200, at 25°C) and binding affinities to immobilized rhPD-L1 and nivolumab on CM5 sensor chips were determined. rhPD-L1 and nivolumab were immobilized onto the gold surface of a CM5 sensor chip by direct amine coupling. Panels a1-a3 represents the different forms of peptide binding to rhPD-L1 and Panels a4-a6 binding to nivolumab
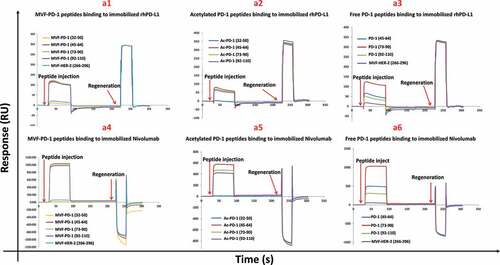
Figure 3. Immunogenicity and preliminary assessment of hPD-1 peptide epitopes in BALB/c mice syngeneic model challenged with CT26 colon carcinoma cell line. (a): Scheme of BALB/c mice vaccination and tumor engraftment. BALB/c mice (5 mice/group) 6–8 weeks old, except PBS group, which has 10 mice, were immunized with MVF-peptide immunogens emulsified in ISA 720 with nor-MDP three times and three weeks apart. Mice were immunized with four MVF-PD-1 vaccine constructs [PD-1(32–50), PD-1(45–64), PD-1(73–90), PD-1(92–110)] prior to tumor challenge. Blood was collected weekly and sera tested for antibody titers by ELISA. Two weeks after the third immunization (3Y), the mice were engrafted with CT26 tumor cells 105 per mouse. Control mice were treated twice weekly with PBS (10 mice as per Figure 4) as negative control and twice weekly with anti-mPD-1 mAb 29F.1A12 as positive control starting 2 days after tumor challenge. Tumor growths were observed twice weekly and measured by calipers; (b) Immunogenicity of MVF-PD-1 peptides in BALB/c mice immunized with various peptide constructs. Sera collected weekly were tittered against each individual MVF-PD-1 peptide immunogen. The terminal bleeds were collected 21 days post challenge prior to mice being euthanized. (c) Individual plots of tumor growths in BALB/c mice immunized with MVF-PD-1 vaccine constructs [PD-1(32–50), PD-1(45–64), PD-1(73–90), PD-1(92–110)], PBS as negative control and anti-mPD-1 mAb (29F.1A12 as positive control. (d) Plots of tumor volume LWW at Day 14 and Day 16 for each of the four treatment groups; Two-way ANOVA was used to analyze the whole curves of tumor growth, which shows significant difference with p < .01; (e) Percentage of tumor growth inhibition (TGI%) was defined as the difference between median tumor volume (MTV) of treatment group with the PBS control group and the value was calculated by formula: TGI% = 100*(MTV control-MTV test)/MTV control which were calculated at Day 14 and Day 16. (f) Complete response (CR) was defined as tumor volume equal or less than 50 mm3 for at least 3 consecutive measurements during the study. The Log-rank (Mantel-Cox) test was use to compare the percentage of CR in multiple groups
![Figure 3. Immunogenicity and preliminary assessment of hPD-1 peptide epitopes in BALB/c mice syngeneic model challenged with CT26 colon carcinoma cell line. (a): Scheme of BALB/c mice vaccination and tumor engraftment. BALB/c mice (5 mice/group) 6–8 weeks old, except PBS group, which has 10 mice, were immunized with MVF-peptide immunogens emulsified in ISA 720 with nor-MDP three times and three weeks apart. Mice were immunized with four MVF-PD-1 vaccine constructs [PD-1(32–50), PD-1(45–64), PD-1(73–90), PD-1(92–110)] prior to tumor challenge. Blood was collected weekly and sera tested for antibody titers by ELISA. Two weeks after the third immunization (3Y), the mice were engrafted with CT26 tumor cells 105 per mouse. Control mice were treated twice weekly with PBS (10 mice as per Figure 4) as negative control and twice weekly with anti-mPD-1 mAb 29F.1A12 as positive control starting 2 days after tumor challenge. Tumor growths were observed twice weekly and measured by calipers; (b) Immunogenicity of MVF-PD-1 peptides in BALB/c mice immunized with various peptide constructs. Sera collected weekly were tittered against each individual MVF-PD-1 peptide immunogen. The terminal bleeds were collected 21 days post challenge prior to mice being euthanized. (c) Individual plots of tumor growths in BALB/c mice immunized with MVF-PD-1 vaccine constructs [PD-1(32–50), PD-1(45–64), PD-1(73–90), PD-1(92–110)], PBS as negative control and anti-mPD-1 mAb (29F.1A12 as positive control. (d) Plots of tumor volume LWW at Day 14 and Day 16 for each of the four treatment groups; Two-way ANOVA was used to analyze the whole curves of tumor growth, which shows significant difference with p < .01; (e) Percentage of tumor growth inhibition (TGI%) was defined as the difference between median tumor volume (MTV) of treatment group with the PBS control group and the value was calculated by formula: TGI% = 100*(MTV control-MTV test)/MTV control which were calculated at Day 14 and Day 16. (f) Complete response (CR) was defined as tumor volume equal or less than 50 mm3 for at least 3 consecutive measurements during the study. The Log-rank (Mantel-Cox) test was use to compare the percentage of CR in multiple groups](/cms/asset/b2019852-2e33-4f7e-9725-12bce924d55a/koni_a_1818437_f0003_oc.jpg)
Figure 4. Efficacy of MVF-PD-1 (92–110) vaccine candidate in BALB/c mice syngeneic model challenged with CT26 colon carcinoma cell line. (a) Scheme of BALB/c mice vaccination and tumor engraftment. BALB/c mice (8-10 mice/group) 6–8 weeks old were immunized with MVF-PD-1(92–110) vaccine emulsified with nor-MDP adjuvant in ISA 720 vehicle. Mice were immunized three times and three weeks apart, 2 weeks after the third immunization (3Y), the mice were engrafted with 105 CT26 tumor cells per mouse. Control mice were treated twice weekly with PBS as negative control (the PBS group shown in this study and that of Figure 3 are the same since both studies were conducted in parallel) and twice weekly with anti-mPD-1 mAb (29F.1A12) as positive control group starting on Day 2 after tumor challenge. Tumor growths were observed twice weekly and measured by calipers; (b) Immunogenicity of MVF-PD-1 (92–110) peptide epitope vaccine in BALB/c mice. Mice bleeds were collected weekly after the primary immunization, and ELISA was used to detect antibody titers in sera. For example the nomenclature is 2Y+1 signifies one week post 2nd injection; 3Y+2 signifies 2 weeks post 3rd injection; (c) Antibody isotypes in BALB/c mice (3Y+1) after immunization with MVF-PD-1 (92–110) nor-MDP and ISA 720; (d) Individual plots of tumor growths by days in BALB/c mice immunized with MVF-PD-1 peptides, PBS was used as negative control and anti-mPD-1 mAb (29F.1A12) was used as positive control; (e) Plots of tumor volume LWW at Day 14 and Day 16 for each of the three treatment groups, which showed statistical differences with p < .01 and p < .05 respectively analyzed by one-way ANOVA; (f) Percentage of complete response (CR) was used to perform Log-rank (Mantel-Cox) test, which showed the p < .01, and only MVF-PD-1(92–110) group observed CR after Day 9 of tumor challenge
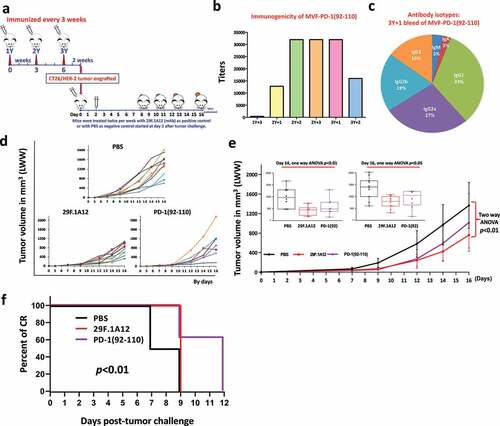
Figure 5. Efficacy of combination treatment of MVF-PD-1 (92–110) vaccine and HER-2 combo HER-2 vaccines in syngeneic BALB/c mice challenged with CT26/HER-2 cells. (a) Scheme of mice vaccination and tumor engraftment. 6–8 weeks BALB/c mice were immunized three times three weeks apart with single MVF-PD-1(92–110); combo HER-2: [MVF-HER-2 (266–297) + MVF-HER-2 (597–626)] and triple: (MVF-PD-1 + combo HER-2) peptides emulsified with nor-MDP adjuvant in ISA 720 vehicle. Two weeks after the third immunization (3Y+2), the mice were engrafted with CT26/HER-2 tumor cells 105 per mouse. Control mice were treated twice weekly with PBS as negative control and twice weekly with anti-mPD-1 mAb (29F.1A12) as positive control starting at Day 2 after challenge. Tumor growths were observed twice weekly and measured by calipers; (b) Immunogenicity profile of single, combo and triple vaccinations in BALB/c mice. Mice bleeds were collected weekly after the primary immunization, and ELISA was used to detect antibody titers in sera; (c) Antibody isotypes: The final bleeds (21 days post-challenge at 3Y+2) were used to detect isotypes i.e., IgA, IgM, IgG1, IgG2a, IgG2b and IgG3) in BALB/c mice after immunization with triple constructs: MVF-PD-1 + combo HER-2 were determined using the Mouse Typer Isotyping Kit (BIO-RAD, Hercules, CA); (d) Individual plots of tumor growth in BALB/c mice up to 16 d. (e) Tumor burden by days in BALB/c mice immunized with the different peptide vaccines as illustrated above, PBS was used as negative control and a positive control group with anti-mPD-1 mAb (29F.1A12). Two-way ANOVA (GraphPad Prism 8.1.2) was used to analyze the whole curve of tumor growth, which shows significant difference with p < .01; One-way ANOVA (online analysis toolCitation59 was used to analyze the tumor burden at Day 14 (inset) and Day 16 (inset), respectively; Note: Two-way ANOVA was performed without Day 9 to Day 13 tumor data; (f) Percentage of tumor growth inhibition (TGI%) was used to compare the treatment groups with the control group. The value was calculated by formula: TGI% = 100*(MTV control-MTV test)/MTV control, both calculated at Day 14 and Day 16. (g) Tumor response in mice. The number of mice observed complete CR in each group. Log-rank (Mantel-Cox) test was use to compare the percentage of CR in multiple groups which showed significant difference with p < .01. (h) The CR was only observed in PD-1(92–110) and triple treatment groups after Day 14. We compared the PD-1(92–110) group with triple treatment group by Fisher’s exact test both at Day 14 and Day 16, with p < .01 and p < .05, respectively. Our results show that triple treatment has stronger inhibition of tumor growth n = 9–10 mice in each group
![Figure 5. Efficacy of combination treatment of MVF-PD-1 (92–110) vaccine and HER-2 combo HER-2 vaccines in syngeneic BALB/c mice challenged with CT26/HER-2 cells. (a) Scheme of mice vaccination and tumor engraftment. 6–8 weeks BALB/c mice were immunized three times three weeks apart with single MVF-PD-1(92–110); combo HER-2: [MVF-HER-2 (266–297) + MVF-HER-2 (597–626)] and triple: (MVF-PD-1 + combo HER-2) peptides emulsified with nor-MDP adjuvant in ISA 720 vehicle. Two weeks after the third immunization (3Y+2), the mice were engrafted with CT26/HER-2 tumor cells 105 per mouse. Control mice were treated twice weekly with PBS as negative control and twice weekly with anti-mPD-1 mAb (29F.1A12) as positive control starting at Day 2 after challenge. Tumor growths were observed twice weekly and measured by calipers; (b) Immunogenicity profile of single, combo and triple vaccinations in BALB/c mice. Mice bleeds were collected weekly after the primary immunization, and ELISA was used to detect antibody titers in sera; (c) Antibody isotypes: The final bleeds (21 days post-challenge at 3Y+2) were used to detect isotypes i.e., IgA, IgM, IgG1, IgG2a, IgG2b and IgG3) in BALB/c mice after immunization with triple constructs: MVF-PD-1 + combo HER-2 were determined using the Mouse Typer Isotyping Kit (BIO-RAD, Hercules, CA); (d) Individual plots of tumor growth in BALB/c mice up to 16 d. (e) Tumor burden by days in BALB/c mice immunized with the different peptide vaccines as illustrated above, PBS was used as negative control and a positive control group with anti-mPD-1 mAb (29F.1A12). Two-way ANOVA (GraphPad Prism 8.1.2) was used to analyze the whole curve of tumor growth, which shows significant difference with p < .01; One-way ANOVA (online analysis toolCitation59 was used to analyze the tumor burden at Day 14 (inset) and Day 16 (inset), respectively; Note: Two-way ANOVA was performed without Day 9 to Day 13 tumor data; (f) Percentage of tumor growth inhibition (TGI%) was used to compare the treatment groups with the control group. The value was calculated by formula: TGI% = 100*(MTV control-MTV test)/MTV control, both calculated at Day 14 and Day 16. (g) Tumor response in mice. The number of mice observed complete CR in each group. Log-rank (Mantel-Cox) test was use to compare the percentage of CR in multiple groups which showed significant difference with p < .01. (h) The CR was only observed in PD-1(92–110) and triple treatment groups after Day 14. We compared the PD-1(92–110) group with triple treatment group by Fisher’s exact test both at Day 14 and Day 16, with p < .01 and p < .05, respectively. Our results show that triple treatment has stronger inhibition of tumor growth n = 9–10 mice in each group](/cms/asset/ee4b6d52-e389-4bed-b206-a15bdfb737d2/koni_a_1818437_f0005_oc.jpg)