Figures & data
Figure 1. PFD monotherapy induces tumor regression only in immunocompetent mice. C57BL/6 mice (n = 6 per group) or Balb/c nude mice (n = 5 per group) were subcutaneously engrafted with LLC-luc cells, after tumor establishment, treated orally with PFD. (a) Diagram of the experimental protocol. (b, c) Tumor volume measured over time. Data were analyzed using repeated-measures ANOVA and represented as means ± SEM. (d, e) Top: quantification of bioluminescent imaging on day 9, data were analyzed using Student’s t-test; Bottom: endpoint images. *, p< .05; ns, not significant.
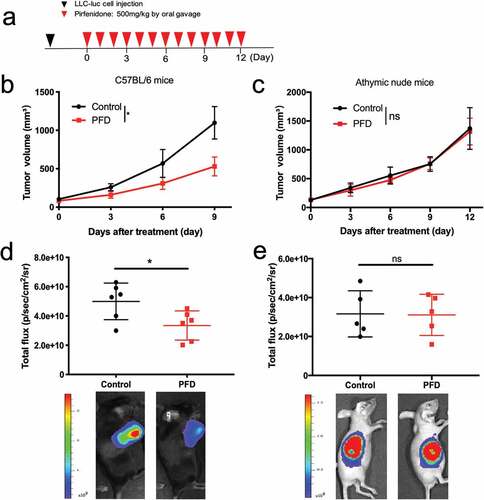
Figure 2. Pirfenidone suppressed the TGFβ signaling pathway and activated the anti-tumor immune response. (a) The absolute number of cytotoxic T cells in LLC-luc tumors on day 9. (b) The absolute number of myeloid-derived suppressor cells (MDSCs) on day 9. (c) Mean fluorescence intensities (MFI) of LAP in the membranes of total live cells in the tumors. FMO: fluorescence-minus-one control. (d) Expression of p-Smad2/3 in total tumor homogenate. (e) C57BL/6 mice were subcutaneously inoculated with MC38 scrambled or Tgfb1-KD cells and treated orally with PFD. Tumor volume was measured over time. (f and g) Left: GSEA plots for RNA-seq data of CD45+ cells isolated from control (n = 3) or PFD treated (n = 5) tumors. Normalized enrichment score (NES) and FDR q value are stated on the plots. Right: genes in the two representative gene sets are labeled in respective heatmaps. Statistical significance in (a ~ c) was measured by Student’s t-test and represented as means ± SD, that in (e) was analyzed using repeated-measures ANOVA with Tukey’s test. *, p< .05; **, p < .01; ***, p < .001; ns, not significant.
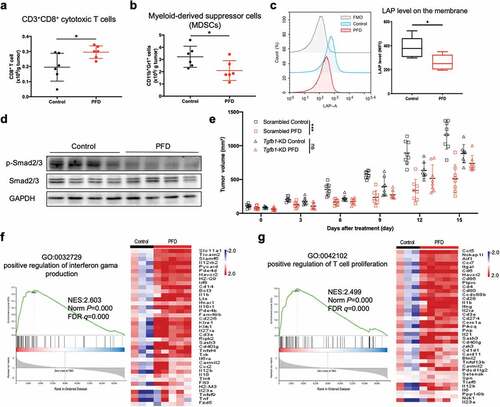
Figure 3. Combining PFD with anti-PD-L1 antibody delays tumor growth and prolongs the survival of tumor-bearing mice. For LLC-luc or MC38 tumors, anti-PD-L1 antibody was administered every 3 d for a total of 7 doses; for H22 tumor, a total of 4 doses of anti-PD-L1 antibody were administered. (a) Diagram of the experimental protocol. (b) LLC-luc tumor volumes were assessed at indicated time points. (n = 6 ~ 10 per group). (c) Survival of mice bearing LLC-luc tumors following treatment. (d) MC38 tumor volumes were assessed at indicated time points. (n = 10 per group). (e) Survival of mice bearing MC38 tumors following treatment. (f) H22 tumor volumes were assessed at indicated time points. (n = 10 per group). (g) Survival of mice bearing H22 tumors following treatment. These experiments were repeated once with similar results. Statistical significance in (b, d and f) was measured by repeated-measures ANOVA with Tukey’s test, that in (c, e and g) was analyzed using the Kaplan-Meier method and compared by the log-rank test. *, p< .05; **, p < .01; ***, p< .001; ns, not significant.
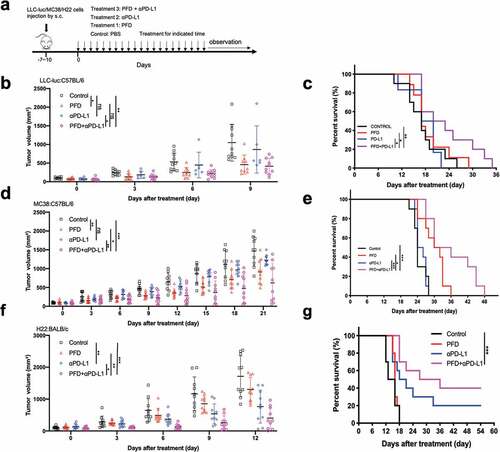
Figure 4. Combining PFD with anti-PD-L1 produces a markedly inflamed immune gene signature. Mice bearing MC38 tumors were treated for 9 d and tumors were analyzed by RNA sequencing (RNA-seq). (a) Heat map of gene expression changes for all significantly differentially expressed genes (defined as P < .05 and a fold change of > 1.5) from RNA-seq analysis. Colors in each box represent the log2(fold change) in the expression of each gene after treatment relative to the median control; rows represent individual genes, and columns represent individual mice. (n = 3 in control and anti-PD-L1 groups, n = 4 in PFD and combination groups). The magnified heat map in the below shows the expression of Tnf, Gzma, Cxcl5, Cxcl1, Cxcl2, and Cxcl12. (b) The 10 most significantly enriched GO terms across experimental groups. (c) Venn diagrams showing the number of shared and treatment-specific DEGs in each group for the GO term “immune response”. (d) Volcano plot of selected DEGs in the combination group relative to control. (e) qRT-PCR validation of selected genes identified by RNA-seq. (n = 5 per group).
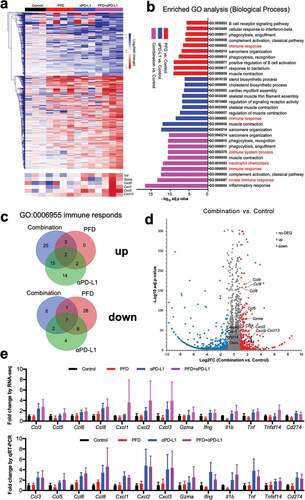
Figure 5. Combination treatment increases infiltration of T cells into the tumor microenvironment. MC38 tumors (n = 6 per group) were harvested on day 9 and IHC and flow cytometry analyses were performed. (a) Representative CD3 staining (200X) of tumor periphery (top) and center (below). Scale bar, 100 μm. (b)Number of CD3+ T cells in the periphery as well as in the center were counted and the ratio of CD3+ T cells in the periphery relative to the center was calculated. (c-f) Flow cytometry analysis was performed and absolute numbers of CD45+ cells (c), MDSC cells (d), CD3+ T cells (e) and CD3+CD8+ cytotoxic T cells (f) per 1.0 g of tumor tissue were calculated. Experiments were repeated twice with similar results. Data was analyzed by one-way ANOVA with Dunnett’s multiple comparison *, p< .05; ns, no significant.
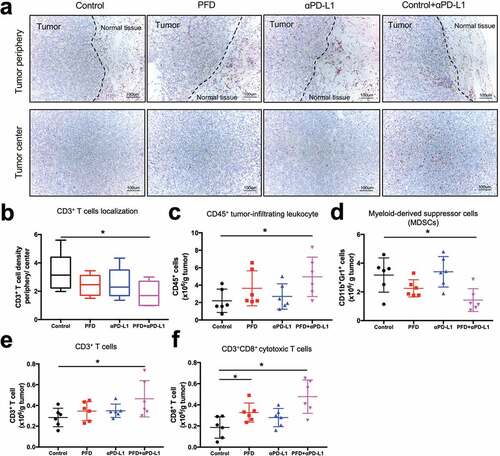
Figure 6. Combination treatment showed promising effect in alleviating pulmonary fibrosis and controlling tumor growth in the tumor-fibrosis model. (a) Diagram of the experimental protocol. (b) Representative images of CT scan, H&E and Masson’s trichrome staining (100X) of mice from different group. (c) Hounsfield units (HU) derived from CT scans. HUs are defined on the basis of – 1,000 for air and 0 for water. (d) Fibrosis scores for grading lung histopathological changes. (e) MC38 tumor volumes were assessed at indicated time points. (n = 8 per group). Statistical significance in (c, d) was measured by one-way ANOVA with Dunnett’s multiple comparison, that in (e) was measured by repeated-measures ANOVA with Tukey’s test *, p< .05; **, p < .01; ***, p< .001; ns, not significant.
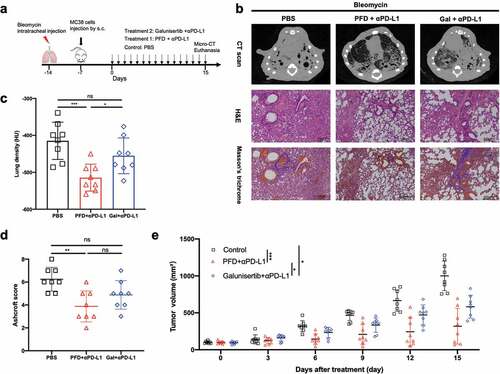
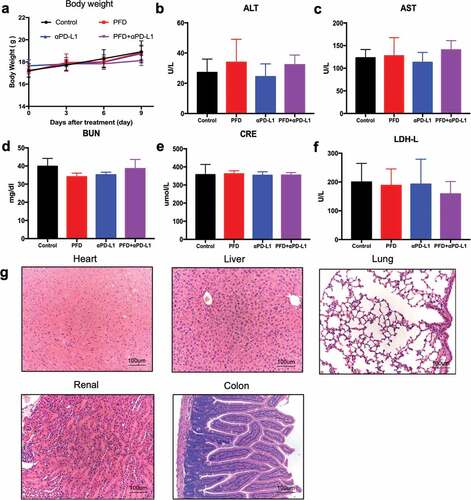
Figure 7. Combination treatment is biologically safe in vivo. Tumor-bearing mice were treated for 9 d and sacrificed for blood and organ collection. (a) Body weight of mice was measured. (b-f) Serum alanine aminotransferase (ALT), aspartate aminotransferase (AST), blood urea nitrogen (BUN), creatinine (CRE), and lactate dehydrogenase (LDH-L) were measured (n = 6 for each group, the experiment was repeated twice.). (g) Representative image of H&E staining (200X) of the heart, liver, lung, kidney, and colon of mice in the combination group.