
Figures & data
Figure 1. Immunohistological staining for CD3+, CD4+, and CD8+ cells in 400-fold magnification.
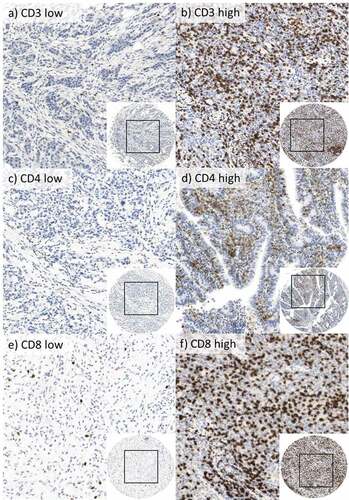
Figure 2. Immunohistochemical staining for PD-1 and PD-L1 expression in tumor cells and TILs in 400fold (b,d,e) and 20fold (a,c,f) magnification.
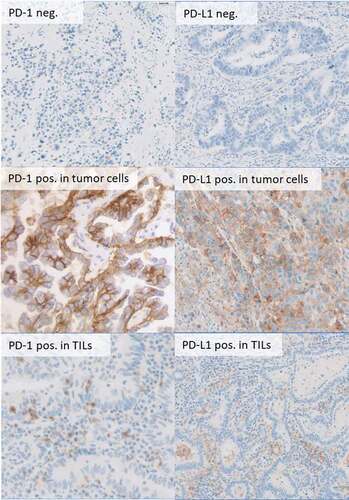
Figure 3. (a) Overall survival depending on high CD3 positive lymphocyte infiltration state. (b) Overall survival depending on PD-1 expression on tumor-infiltrating lymphocytes. (c) Overall survival depending on high CD3 positive lymphocyte infiltration state and UICC stage. (d) Overall survival depending on PD-1 expression on TILs and on CD3 positive lymphocyte infiltration state. (e) Overall survival depending on PD-1 expression in tumor-infiltrating lymphocytes and tumor localization. Tumor samples were grouped for low versus high infiltration with CD3 positive TILs by using the median. For grouping in PD-1 and PD-L1 positive/negative, an expression ≥1% was used as a cutoff.
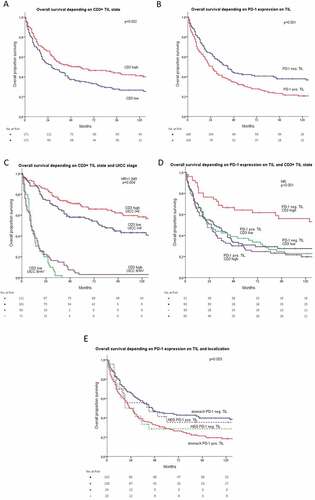
Table 1. Subgroup analyses: overall survival in months related to TIL infiltration state and UICC stage.
Table 2. Univariate and multivariate survival analyses including CD3, CD4, CD8 positive infiltration state and PD-1 and PD-L1 positive infiltration state.