Figures & data
Table 1. Univariate Cox analysis of costimulatory molecule genes in TCGA Cohort.
Table 2. Clinical characteristics of the enrolled patients.
Figure 1. Identification of the CMS in the TCGA dataset. (a) the distribution of risk score, survival status, and the five-gene expression panel. Kaplan-Meier curves were conducted to estimate overall survival for the high- and low-risk groups based on the risk score; (b) total patients with LUAD (c) patients with early-stage (stage I and II) LUAD. (d) patients with advanced-stage (stage III and Ⅳ) LUAD.
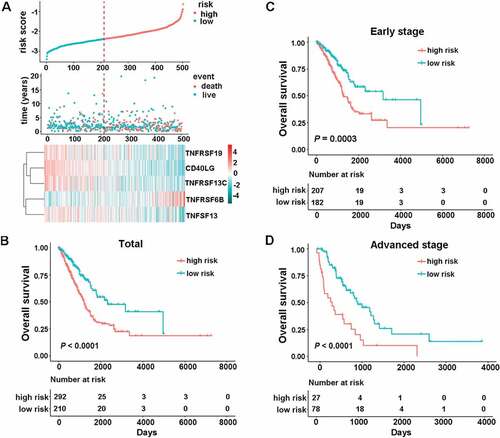
Table 3. Univariable and multivariable Cox regression analysis of the costimulatory molecule-based signature and survival in TCGA dataset.
Figure 2. The association between CMS and overall survival in nine different validation cohorts. Kaplan-Meier curves were created to estimate overall survival for in high- and low-risk groups based on the risk score. (a) GSE11969 (range from −0.0685 to 0.2331); (b) GSE13213 (range from −0.7562 to 0.5577); (c) GSE19188 (range from −0.2603 to 0.3283); (d) GSE30219 (range from −2.5093 to −1.5032); (e) GSE31210 (range from −2.9149 to −1.5841); (f) GSE37745 (range from −2.5732 to −1.6179); (g) GSE41271 (range from −1.8310 to −0.0865); (h) GSE50081 (range from −2.4230 to −1.4792); (i) an independent cohort with qPCR data.
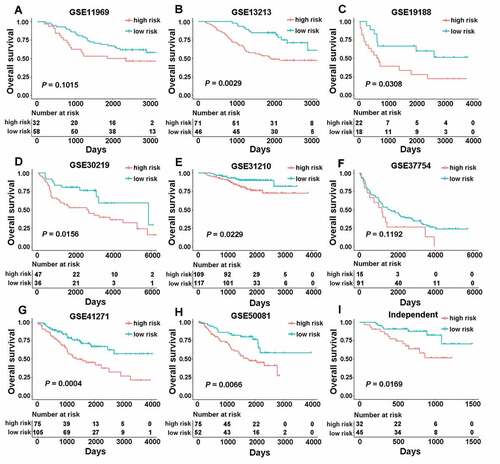
Figure 3. Compare CMS with previous costimulatory molecules signature. (a) a meta‐analysis was performed using the prognostic results of CMS in nine public datasets. (b) a meta‐analysis was performed using the prognostic results of the B7-CD28 signature in nine public datasets.
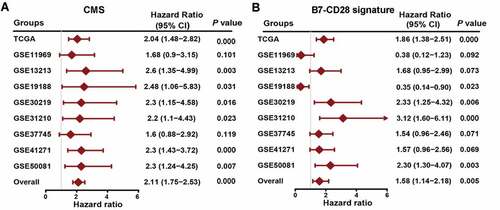
Figure 4. CMS-related biological pathways. (a) the most related genes of TNF family-based signature in patients with LUAD (Pearson |R| > 0.45, P < .0001). (b and c) GO and KEGG analyses of the related genes.
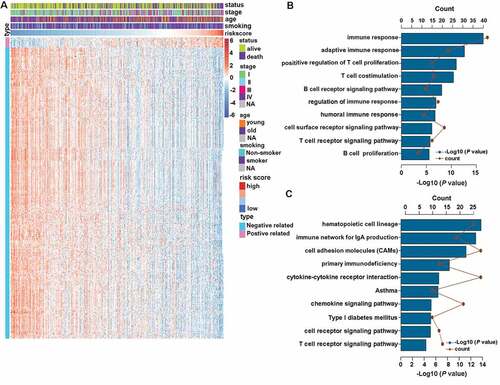
Figure 5. CMS-related immune cell infiltration and inflammatory activities. (a) the relative proportion of immune cell expression in high- and low-risk patients. (b and c) differentially expression immune cells in high- and low-risk patients. (d) the details of seven inflammatory metagenes and risk score. (e) correlogram of risk score, and inflammatory metagenes. *, **, ***, and **** represent P < .05, P < .01, P < .001 and P < .0001, respectively.
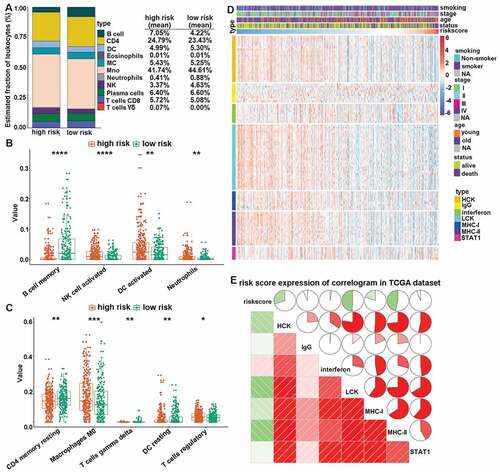
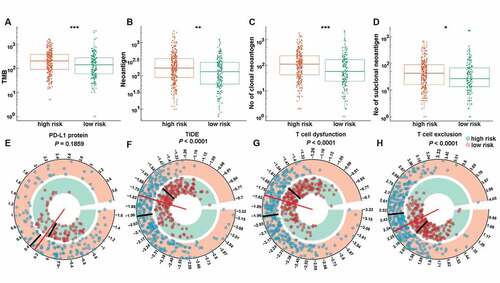
Figure 6. The expression pattern of immunotherapy response makers in high- and low-risk groups. The distribution of TMB (a), number of neoantigens (b), number of clonal neoantigens (c), number of subclonal neoantigens (d), protein level of PD-L1 (e), TIDE score (f), T cell dysfunction score (g) and T cell exclusion score (h) in high- and low-risk groups. *, **, ***, and **** represent P < .05, P < .01, P < .001 and P < .0001, respectively.