Figures & data
Figure 1. CTAs with a statically significant change in expression or reexpressed after one cycle of azacitidine. A) CTAs expressed at baseline that show a significant change after the first cycle of azacitidine, grouped by patients response. B) CTAs that do not detected at diagnosis (CPM <1) but which experience the novo expression in patients who reached CR. The inclusion criteria are those described in the text. i) all patients, ii) in the group with any type of response, iii) in the group of patients with partial response and iv) the group of patients who achieved a complete response.
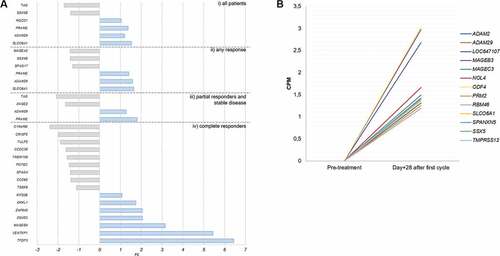
Figure 2. TFDP3 and DDX53T-RNA derepression in CR patients after one cycle of azacitidine and proteomic validation. Radar charts displaying TFDP3 (a) and DDX53 (b) CPM for each of the T-RNA-seq patients grouped by response. The blue line depicts the expression before treatment and the red line on day +28 of the first azacitidine cycle. (c,d) Upper panel showing western Blot experiment on plasma in 4 out of 5 CR showing dinamics in TFDP3 and DDX53 proteins levels through the course of treatment with azacitidine. For UPN15 and UPN5 plasma was available from pretreatment, cycle 1 + 28 and cycle2 + 28 timepoints; for UPN16 plasma was available from pretreatment, cycle 1 + 28, cycle2 + 28 and cycle3 + 28 timepoints; for UPN17plasma was available from pretreatment and cycle 1 + 28 timepoints. Middle panel: ponceau staining was used for normalization. Bottom panel: pretreatment and cycle 1 + 28 linear representation of protein and gene expression level for UPN15, UPN17, UPN16 and UPN5. (e,f) Violin plots illustrating TFDP3 and DDX53 fold change, by means of ELISA, between cycle 1 + 28 and pretreatment sample in 20 patients including 14 T-RNA-seq cases.
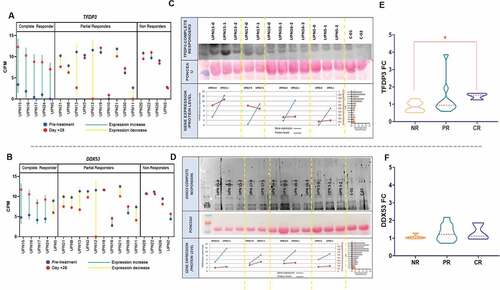
Figure 3. Gene expression and protein level dynamics through the first and second azacitidine cycles. Gene expresión as CPMs from T-RNA-seq assay and protein levels as ng/ml from plasma ELISA. a,b) TFDP3 in two CR patients. e,f) DDX53 in two CR patients. c,d) TFDP3 in two PR patient. g,h) in three PR patients (blue line), one nonresponder patient (orange line) and an stable disease patient (purple line).
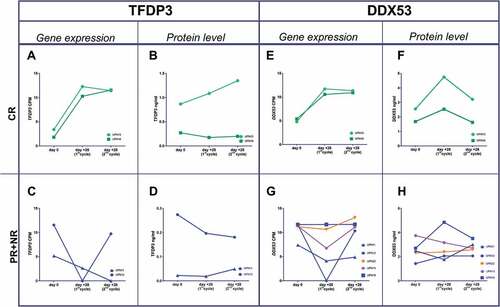
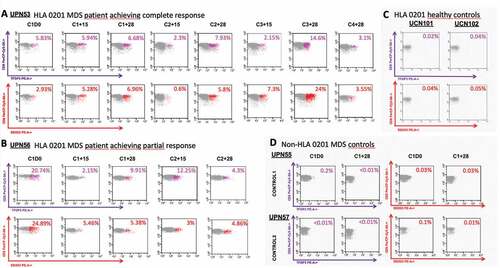
Figure 4. Detection and monitoring of TFDP3 and DDX53-specific CD8 + T cells using Class I MHC Tetramers. (a) Dot-plot of TFDP3 (purple) DDX53 (red) assessing the percentages of specific TFDP3 and DDX53 CD8 + T-cell within the CD8+ compartment during the course of treatment in patient who achieved a CR after the six cycle of azacitidine. B. Dot-plot of TFDP3 (purple) DDX53 (red) assessing the percentages of specific TFDP3 and DDX53 CD8 + T-cell within the CD8+ compartment during the course of treatment in patient who achieved a PR after the six cycle of azacitidine. C&D. Specificity of the HLA0201 tetramer was tested by staining PBMCs from two HLA0201 healthy donors at baseline and 2 non-HLA0201 MDS patients (HLA A*24 and HLA A*01) at baseline and after one cycle of azacitidine.