Figures & data
Table 1. Top 100 genes co-expressed with F5 in tumors of the Scandinavian breast cancer cohort and the TCGA breast cancer cohort.
Figure 1. GO analysis of the F5 co-expressed genes in breast tumors.
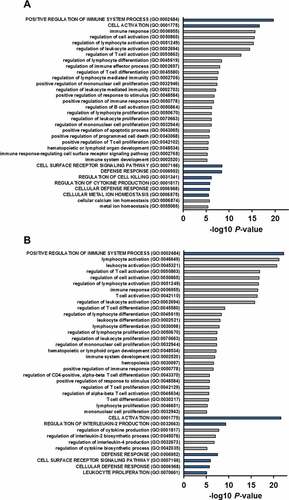
Figure 2. T cell activation marker CD69 levels, WST-1 proliferation analysis and cell migration of FV treated Jurkat T cells.
Figure 3. Correlations between F5 tumor expression and breast cancer specific gene modules.
Figure 4. F5 tumor expression according to the degree of TILs.
Figure 5. Tumor abundance of subsets of leukocytes according to F5 expression.
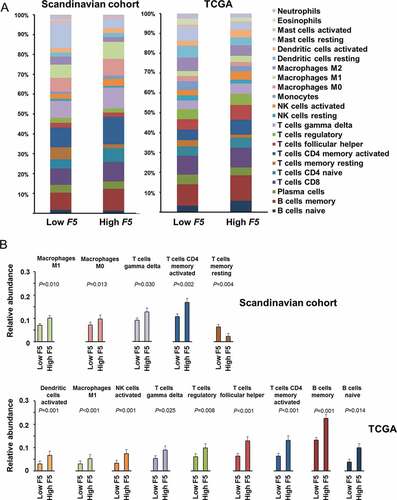
Table 2. Correlations between F5 and gene markers of immune cells in the TCGA Breast cancer population in TIMER18.
Figure 6. Correlation between F5 tumor expression and tumor purity in breast cancer.
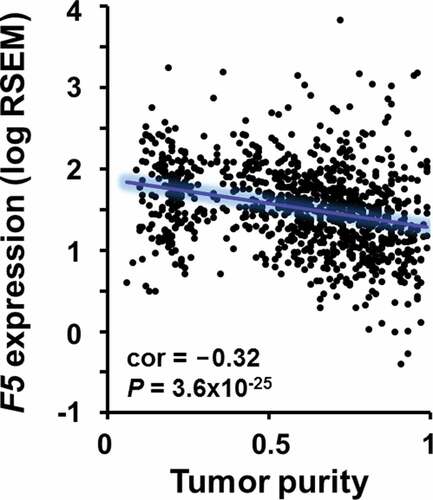
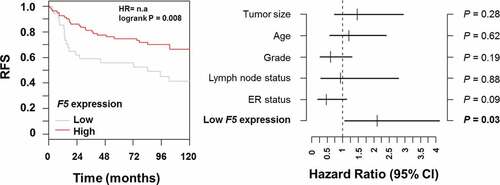
Figure 7. Relapse-free survival in breast cancer patients stratified by F5 expression in tumors.
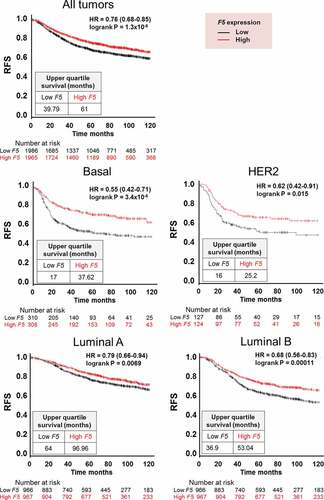
Figure 8. Multivariate analysis of relapse-free survival in breast cancer patients stratified by F5 expression in tumors.